Study the given information carefully and answer the questions that follow.
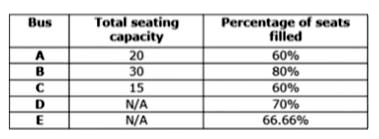
The table given below shows the capacity of 5 buses (A, B, C, D, E) and the percentage of seats that were filled out of the total seating capacity of the buses.

Some of the data is missing and is denoted as N/A
A) The total number fo vacant seats in all the 5 buses together were 40
B) The number of seats in buses D and E together were 65
What is the average of the vacant seats of buses B, C, D and E?
A)16
B)8
C)24
D)22
The correct Answer is:B
Step by step video, text & image solution for Study the given information carefully and answer the questions that follow. The table given below shows the capacity of 5 buses (A, B, C, D, E) and the percentage of seats that were filled out of the total seating capacity of the buses. Some of the data is missing and is denoted as N/A A) The total number fo vacant seats in all the 5 buses together were 40 B) The number of seats in buses D and E together were 65 What is the average of the vacant seats of buses B, C, D and E? by Maths experts to help you in doubts & scoring excellent marks in Class 14 exams.
Similar Questions
The area of the shaded part in the figure given below is ______.
 02:03View Solution
The inequation represented by the graph given below is :
02:10View SolutionThe inequation that best describes the graph given below is _________
02:17View SolutionThe inequation that best describes the following graph is _________
02:10View SolutionIn the given figure, PQRS is a parallelogram. A and B are the mid-point of ¯¯¯¯¯¯PQ and ¯¯¯¯¯SR respectively. If PS=BR, then the quadrilateral ADBC is a…………………… ,
ltimg src="https://d10lpgp6xz60nq.cloudfront.net/physics_images/PS_MATH_IX_C12_E05_020_Q01.png" width="80%"gt03:02View SolutionThe total surface area of the given solid figure is _______________.
 01:52View Solution
Identify A,B,C and D,E
02:22View Solution

