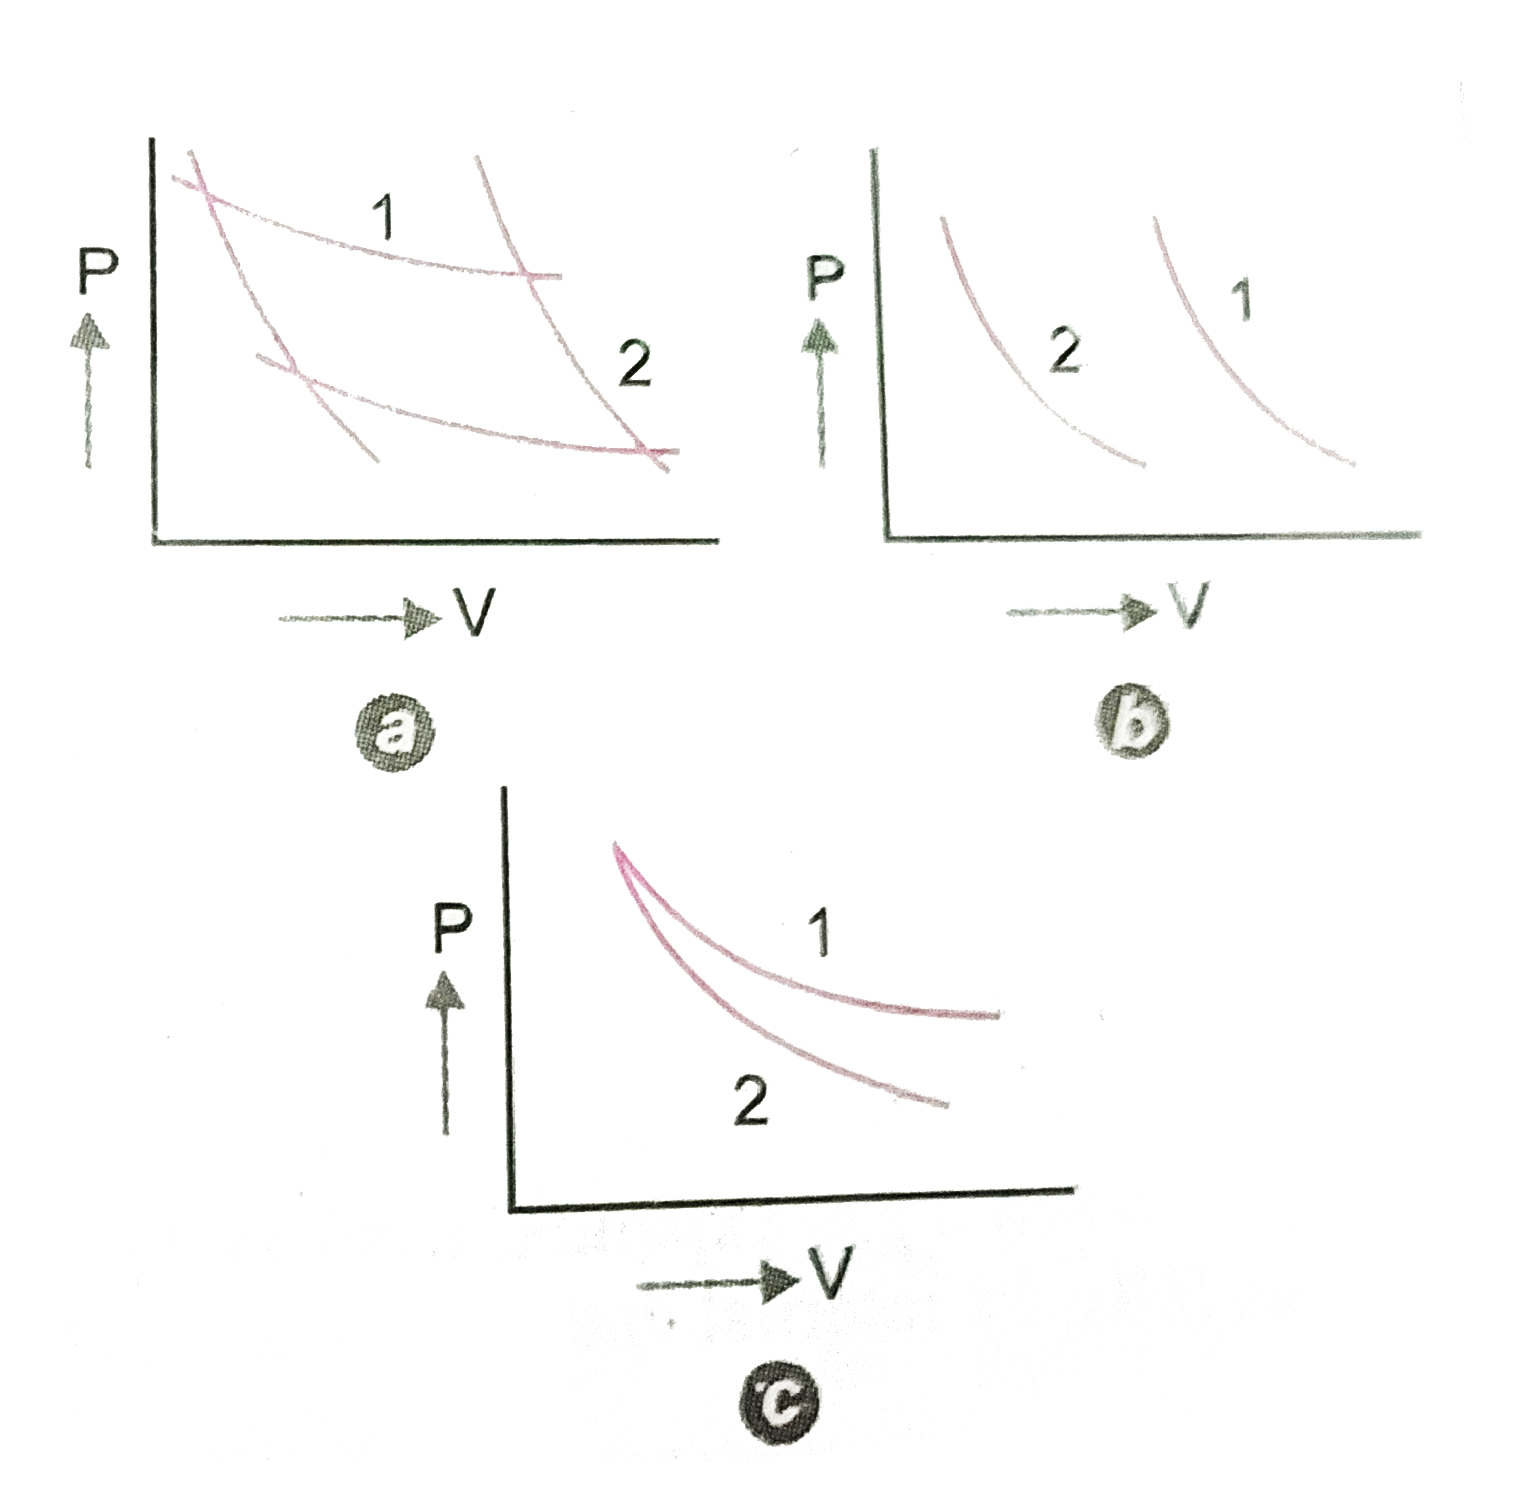
For adiabatic process, the slope of indicator P-V diagram is
γPV
γVP
PγV
0
The correct Answer is:A
For adiabatic process, PVγ =constant
Slope = dPdV
VγdPdV+γPVγ−1=0⇒V.dPdV+γP=0,⇒dPdV=−γPV
Similar Questions
Knowledge Check
Assertion: Isothermal and adiabatic, two processes are shown on p-V diagram. Process-1 is aidabatic and process-2 is isothermal.
Reason: At a given point, slope of adiabatic process =γ×slope of isothermal process.
 AIf both Assertion and Reason are true and the Reason is correct explanation of the Assertion.BIf both Assertion and Reason are true but Reason is not the correct explanation of Assertion.CIf Assertion is true, but the Reason is false.DIf Assertion is false but the Reason is true.
Assertion: P v/s 1V graph is straight line for adiabatic process.
Reason: PV=constant for adiabatic process.AIf both assertion and reason are true and reason is the correct explanation of assertion.BIf both assertion and reson are true but reason is not the correct explanation of assertion.Cif assertion is true but reason is false.DIf both assertion and reason are false.For a given thermodynamic process, the P – V diagram is as shown below:
Which of the following is the V – T diagram for the process?
A→C: isobaric
B→C: adiabatic
C→A : isothermal
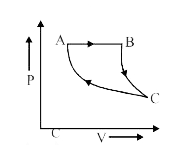 A
A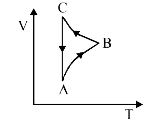 B
B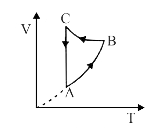 C
C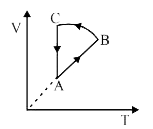 D
D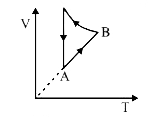
Assertion: Isothermal and adiabatic, two processes are shown on p-V diagram. Process-1 is aidabatic and process-2 is isothermal.
Reason: At a given point, slope of adiabatic process =γ×slope of isothermal process.

View SolutionAn ideal gas follows a process PVγ = constant where γ = adiabatic exponent.The slope of P-V graph will be represented by
View SolutionAssertion: P v/s 1V graph is straight line for adiabatic process.
Reason: PV=constant for adiabatic process.
View SolutionFor a given thermodynamic process, the P – V diagram is as shown below:
Which of the following is the V – T diagram for the process?
A→B: isobaric
B→C: adiabatic
C→A : isothermal

View SolutionFor a given thermodynamic cyclic process, P−V indicator diagram is as shown in the figure. Process AB,BC&CA are isobaric, & isothermal respectively. Then which of the following curve represent correc V−T indicator diagram for the process ABCA?
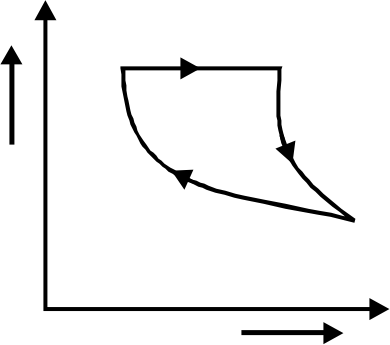
View Solution

