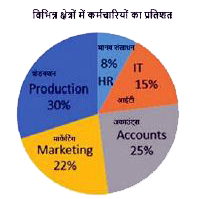
दिया गया पाई आरेख किसी कम्पनी के अलग-अलग विभागों में कुल 800 कर्मचारियों के प्रतिशत वितरण को दर्शाता है।

मार्केटिंग के क्षेत्र में कितने कर्मचारी कार्यरत हैं ?
240
200
176
120
The correct Answer is:C
Step by step video & image solution for दिया गया पाई आरेख किसी कम्पनी के अलग-अलग विभागों में कुल 800 कर्मचारियों के प्रतिशत वितरण को दर्शाता है। मार्केटिंग के क्षेत्र में कितने कर्मचारी कार्यरत हैं ? by Maths experts to help you in doubts & scoring excellent marks in Class 14 exams.
Similar Questions
The inequation that best describes the graph given below is _________
02:17View SolutionThe inequation that best describes the following graph is _________
02:10View SolutionWhich inequations represent the shaded region in the given figure
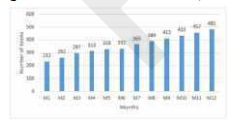
04:23View SolutionThe bar graph given below presents the number of books sold by a bookseller during different months of a year.
नीचे दिया गया दंड आरेख एक पुस्तक विक्रेता के द्वारा किसी वर्ष के अलग-अलग महीनों में बेची गयी पुस्तकों की संख्या को दर्शाता है | What is the total number of books sold by the bookseller in the year?
वर्ष में इस पुस्तक विक्रेता के द्वारा बेची गयी पुस्तकों की संख्या कुल कितनी है ?01:39View SolutionThe Pie Chart shows the angular representation of five different Employment sectors. The total number of employees in these five sectors is 7,20,000. यह पाई-चार्ट पांच अलग-अलग रोज़गार क्षेत्रों के कोणीय प्रतिनिधित्व को दर्शाता है | इन पांच क्षेत्रों में कर्मचारियों की कुल संख्या 7,20,000 है| How many total employees are engaged in Agriculture, Business and Transport? कृषि, व्यवसाय और परिवहन में कुल कितने कर्मचारी संलग्न हैं?
01:19View SolutionThe Pie Chart shows the angular representation of five different Employment sectors. The total number of employees in these five sectors is 7,20,000. यह पाई-चार्ट पांच अलग-अलग रोज़गार क्षेत्रों के कोणीय प्रतिनिधित्व को दर्शाता है | इन पांच क्षेत्रों में कर्मचारियों की कुल संख्या 7,20,000 है| How many more employees are engaged in Industry than Business? उद्योग में व्यवसाय की तुलना में कितने अधिक कर्मचारी संततग्न हैं ?
01:11View SolutionThe Pie Chart shows the angular representation of five different Employment sectors. The total number of employees in these five sectors is 7,20,000. यह पाई-चार्ट पांच अलग-अलग रोज़गार क्षेत्रों के कोणीय प्रतिनिधित्व को दर्शाता है | इन पांच क्षेत्रों में कर्मचारियों की कुल संख्या 7,20,000 है| How much percent employees are in Service Sector? कितने प्रतिशत कर्मचारी सैवा क्षेत्र में है?
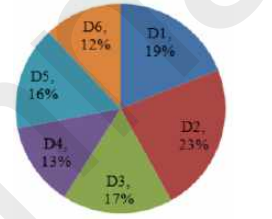
01:19View SolutionThe pie-chart given below shows the expenses incurred by various departments of a company. Each expense is shown as a percentage of the company.s total expenditure. The central angles shown in the pie-chart are not according to any selected scale.
नीचे दिया गया वृत्त आरेख किसी कंपनी के विभिन्न विभागों द्वारा किए खर्चों को दर्शाता है | प्रत्येक खर्च को कंपनी के कुल व्यय के प्रतिशत के रूप में दर्शाया गया है | वृत्त आरेख में दर्शाए गए केंद्रीय कोण किसी चयनित पैमाने के अनुसार नहीं हैं | If the total expenses of the company is 20 lacs, then find the total expenses incurred on the
departments D2, D4 and D5.
यदि कंपनी के कुल खर्चे रु 20 लाख हैं, तो D2, D4 तथा D5 विभागों पर किया गया कुल खर्चा कितना है ?02:19View Solution

