Which music director composed the Odisha Men's Hockey World Cup 2018 anthem? / किस संगीत निर्देशक ने उड़िसा पुरुष हॉकी विश्व कप 2018 के गान की रचना की?
AR Rahman / ए आर रहमान
Shankar Mahadevan / शंकर महादेवन
Amit Trivedi / अमित त्रिवेदी
Ilaiyaraaja / इलयराजा
The correct Answer is:A
Step by step video, text & image solution for Which music director composed the Odisha Men's Hockey World Cup 2018 anthem? / किस संगीत निर्देशक ने उड़िसा पुरुष हॉकी विश्व कप 2018 के गान की रचना की? by Maths experts to help you in doubts & scoring excellent marks in Class 14 exams.
Updated on:21/07/2023Similar Questions
The given bar chart shows the details of cycle sales by a company between January and May for years 2017 and 2018.
दिया गया दंड आरेख वर्ष 2017 एवं 2018 में एक कंपनी के द्वारा जनवरी से लेकर मई तक साइकिल बिक्री की जानकारी देता है |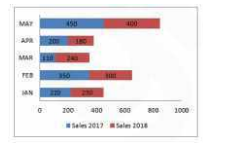 In the given bar-chart, which month sale shows the maximum increase in 2018 as against 2017?
/ दिए गए दंड आरेख के नुसार किस महीने की बिक्री 2017 की तुलना में 2018 में अधिकतम वृद्धि दर्शाती है ?
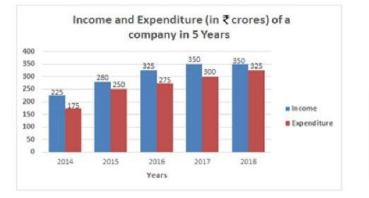
View SolutionThe given Bar Graph presents Income and Expenditure (in crores of Rupees) of a company for five years, 2014 to 2018. In which year is the Expenditure more than 40% as compared to the Expenditure in the previous year? दिया गया दंड आरेख (बार ग्राफ) 5 वर्षो, 2014 से 2018 के दौरान किसी कंपनी की आय और व्यय (करोड़ रुपए में) को दर्शाता है| पिछले वर्ष के व्यय की तुलना में किस वर्ष में वह 40% अधिक है?
View Solution
Knowledge Check
Which of the following countries won the Men’s Hockey World Cup 2018?
ABelgiumBNew ZealandCArgentinaDPakistanWho won Hockey Men's world cup 2018 held in Odisha, India?
ABelgiumBGermanyCIndiaDAustraliaWhich country hosted the Global IT Challenge for youth with Disabilities
किस देश ने युवा आईटी अक्षमता चैलेंज 2018 की मेजबानी की?AIndia/भारतBSingapore/सिंगापुरCChina/चीनDThailand/थाईलैंड
The given Bar Graph presents the Revenue of Expenditure (in crores of rupees) of a company during the five year period, 2014 - 2018.
दिया गया दंड आरेख (Bar graph) 5 वर्ष की अवधि 2014-2018 के दौरान किसी कंपनी के राजस्व और व्यय (करोड़ रुपए में) को दर्शाता है|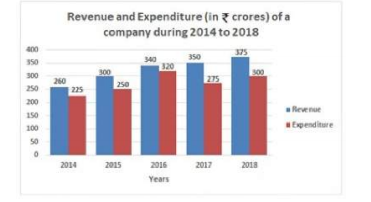 किस वर्ष में राजस्व में प्रति प्रतिशत वृद्धि इसके पिछले वर्ष की तुलना में 5% और 8% के बीच है?
In which year the percentage increase in revenue as compared to that in its preceding year is between 5% and 8% ?
View SolutionThe given bar chart shows the details of cycle sales by a company between January and May for years 2017 and 2018.
दिया गया दंड आरेख वर्ष 2017 एवं 2018 में एक कंपनी के द्वारा जनवरी से लेकर मई तक साइकिल बिक्री की जानकारी देता है |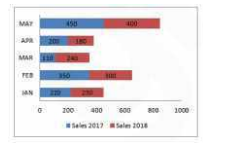 In the given bar-chart, which month sales show the maximum decrease in 2018 as compared to 2017?
दिए गए दंड आरेख में, किस माह की बिक्री 2017 की तुलना में 2018 में अधिकतम कमी को दर्शाती है ?
View SolutionThe given Bar Graph presents Income and Expenditure (in crores of Rupees) of a company for the five years, 2014 to 2018.
दिया गया दंड आरेख पांच वर्षों अर्थात 2014 से 2018 तक एक कंपनी के आय एवं व्यय ( करोड़ रुपये में ) को दर्शाता है |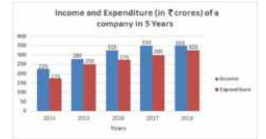 In which year is the Expenditure more than 40% as compared to the Expenditure in the previous year?
किस वर्ष में व्यय पिछले वर्ष के व्यय की तुलना में 40% अधिक है ?
View SolutionThe given Bar Graph presents the results in terms of the number of students in a school for the five academic years, 2013-2014 to 2017-2018.
दिया गया दंड आरेख (बार ग्राफ) पाँच शैक्षणिक वर्षों , 2013-2014 से 2017-2018 तक, के दौरान एक स्कूल के परीक्षाफल के संदर्भ में विधाथ्थियों की संख्या को दर्शाता है।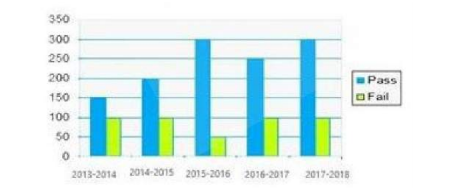
In which academic year the difference between the number of students passed and and that of those failed is the lowest?
किस शैक्षणिक वर्ष में उत्तीर्ण और अनुत्तीर्ण विद्यार्थियों की संख्या के बीच का अंतर सबसे कम है?
View SolutionThe given Bar Graph presents the results in terms of the number of students in a school for the five academic years, 2013-2014 to 2017-2018.
दिया गया दंड आरेख पांच शैक्षणिक वर्षों : 2013-2014 से 2017-2018 तक एक विद्यालय में छात्रों की संख्या के संदर्भ में परिणामों को प्रस्तुत करता है |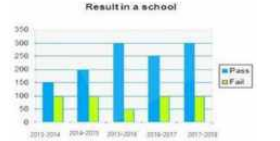 In which academic year the difference between the number of students passed and that of those
failed is the lowest?
किस शैक्षणिक वर्ष में, पास करने वाले छात्रों तथा फेल करने वाले छात्रों की संख्या में सबसे कम अंतर है ?
View Solution
