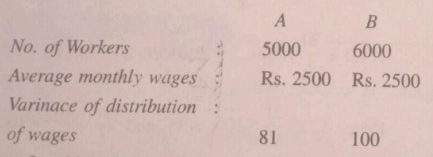
Two plants A and B of a factory show following results about the number of workers and the wages paid to them :
 In which plant, A or B, is there greater variability in individual wages ?Solution in Punjabi
Step by step video & image solution for Two plants A and B of a factory show following results about the number of workers and the wages paid to them : In which plant, A or B, is there greater variability in individual wages ? by Maths experts to help you in doubts & scoring excellent marks in Class 11 exams.
Updated on:21/07/2023Topper's Solved these Questions
Similar Questions
Find the mean deviation from the mean for the following data : 6,7,10,12,13,4,8,12.
View SolutionWhich of the following are sets ? Justify your answer. The collection of all the months of a year beginning with the letter J.
View SolutionWhat is the slope of the line whose inclination is :
0∘ ?
View SolutionTwo plants A and B of a factory show following results about the number of workers and the wages paid to them.

In which plant, A or B is there greater variability in individual wages?
View SolutionTwo plants A and B of a factory show following results about the number of workers and the wages paid to them. Plant A Plant B No. of workers 5000 6000 Average monthly wages Rs. 2500 Rs. 2500 Variance of distribution of wages 81 100 In which plant A or B is there greater variability in individual wages?
View SolutionDetermine the point of symmetry of a regular hexagon.
View SolutionMatch the following Column A to Column B

View SolutionMatch the following Column A to Column B

View SolutionMatch the following Column A to Column B

View SolutionThe inequation represented by the graph given below is :
View SolutionThe inequation that best describes the graph given below is _________
View SolutionThe inequation that best describes the following graph is _________
View SolutionTwo plants A and B of a factory show following results about the number of workers and the wages paid to them.
ABNumber of workers50006000Average monthly wagesRs.2500Rs.2500Variance of distribution of wages81100
In which plant, A or B is greater variability in individual wages?
View SolutionTwo plants A and B of a factory show following results about the number of workers and the wages paid to them.
ABNo. of workers50006000Average monthly wagesRs 2500Rs 2500Variance of distribution of wages81100
In which plant, A or B is there greater variability in individual wages?
View SolutionTwo plants A and B of a factory show following results about the number of workers and the wages paid to them.
ABNo. of workers50006000Average monthly wagesRs 2500Rs 2500Variance of distribution of wages81100
In which plant, A or B is there greater variability in individual wages?
View SolutionTwo plants A and B of a factory show following results about the number of workers and the wages paid to them.
ABNo. of workers50006000Average monthly wagesRs 2500Rs 2500Variance of distribution of wages81100
In which plant, A or B is there greater variability in individual wages?
View Solution
