निम्नांकित सारणी किसी पुस्तकालय में रखी विभिन्न विषयों की पुस्तकों की संख्या को दर्शाता है :
 दी हुई आँकड़ों के लिए एक दण्डालेख प्रस्तुत कीजिए।
The correct Answer is:(##BBPHINDGPMATVIC15E05006_A01##)
Step by step video, text & image solution for निम्नांकित सारणी किसी पुस्तकालय में रखी विभिन्न विषयों की पुस्तकों की संख्या को दर्शाता है : दी हुई आँकड़ों के लिए एक दण्डालेख प्रस्तुत कीजिए। by Maths experts to help you in doubts & scoring excellent marks in Class 6 exams.
Updated on:21/07/2023Topper's Solved these Questions
- आँकड़ों का संग्रह तथा प्रबंधन BOOK - DAS GUPTACHAPTER - आँकड़ों का संग्रह तथा प्रबंधन EXERCISE - दशम जाँच -परीक्षा प्रश्न-पत्र
18 Videos
- आँकड़ों का संग्रह तथा प्रबंधन BOOK - DAS GUPTACHAPTER - आँकड़ों का संग्रह तथा प्रबंधन EXERCISE - प्रश्नमाला 15( C )
39 Videos
- अनुपात और समानुपात BOOK - DAS GUPTACHAPTER - अनुपात और समानुपात EXERCISE - प्रश्नमाला 7 (B)
18 Videos
- आधारभूत ज्यामितीय संकल्पनाएँBOOK - DAS GUPTACHAPTER - आधारभूत ज्यामितीय संकल्पनाएँEXERCISE - प्रश्नमाला 10 (D)
25 Videos
Similar Questions
उस चतुर्भुज का परिमाप ज्ञात कीजिए जिसकी भुजाएँ 8 सेमी, 6 सेमी', 5 सेमी तथा 9 सेमी हैं।
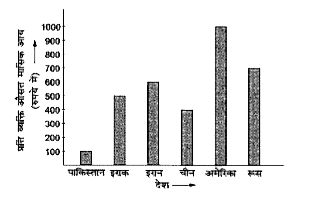
View Solutionनीचे दिए गए दण्ड-आलेख का अध्ययन सावधानीपूर्वक कीजिए।

अब निम्नलिखित प्रश्नों के उत्तर दीजिए
ऊपर के दण्ड-आलेख से क्या सूचना प्राप्त होती है?
View Solutionनिम्नलिखित में से प्रत्येक कथन के आगे सत्य या असत्य लिखिए।
14 :18 :: 21 : 27
View Solutionकिसी वृत्त में कितने केन्द्र होते हैं ?
View SolutionHow many lines of symmetry does the above figure have ?
View SolutionWhich of the following are correct chain isomers of butane ? (i)
View SolutionDetermine the point of symmetry of a regular hexagon.
View SolutionDtermine the images of the following figure about the given line :
View SolutionMatch the following Column A to Column B

View SolutionMatch the following Column A to Column B

View SolutionMatch the following Column A to Column B

View SolutionFind the area of the figure given below.

View SolutionThe area of the shaded part in the figure given below is ______.

View SolutionThe inequation represented by the graph given below is :
View SolutionThe inequation that best describes the graph given below is _________
View SolutionThe inequation that best describes the following graph is _________
View Solution
