Ready the following graph carefully and answer the questions given below.
Crude oil price (in Rs.) per metric tonne
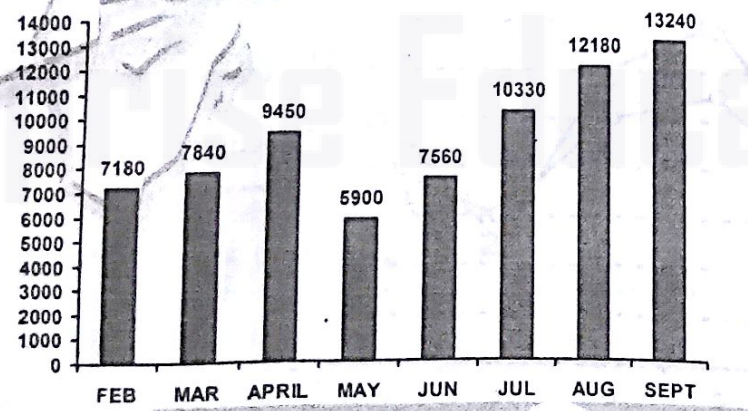
How many months experienced more than 10 percent increase in crude oil price over the earlier month ?
One
Two
Three
Four
The correct Answer is:D
Step by step video, text & image solution for Ready the following graph carefully and answer the questions given below. Crude oil price (in Rs.) per metric tonne How many months experienced more than 10 percent increase in crude oil price over the earlier month ? by Maths experts to help you in doubts & scoring excellent marks in Class 14 exams.
Updated on:21/07/2023Topper's Solved these Questions
Similar Questions
Ready the following graph carefully and answer the questions given below.
Crude oil price (in Rs.) per metric tonne
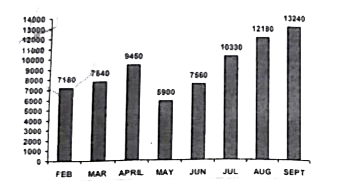
What is the average crude oil price if all the months taken together ?
View SolutionStudy the following graph carefully and answer the questions that
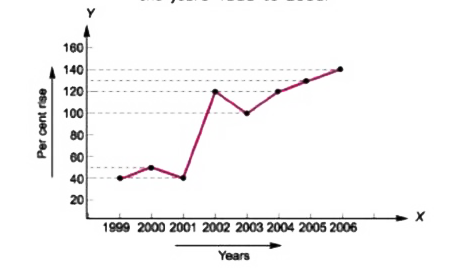
For how many years , the percent rise was more than 100 % ?
View Solution
Knowledge Check
Ready the following graph carefully and answer the questions given below.
Crude oil price (in Rs.) per metric tonne
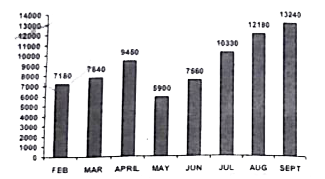
Which month experienced more than 10 percent but less than 20 percent increase in the price of crude oil over the earlier month ?AA) AprilBB) AugustCC) SeptemberDD) JuneReady the following graph carefully and answer the questions given below.
Crude oil price (in Rs.) per metric tonne
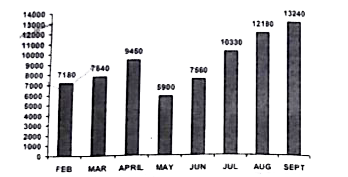
What is the approximate percentage increase in the price of crude oil from February to September ?AA) 84%BB) 93%CC) 89%DD) 76%Ready the following graph carefully and answer the questions given below.
Crude oil price (in Rs.) per metric tonne
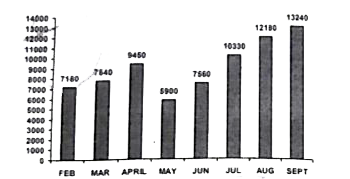
What is the respected ratio of crude oil price of May to the price of crude oil of April ?AA) 117:187BB) 189:118CC) 187:117DD) 118:189
Examine the following graph carefully and answer the questions given below it :
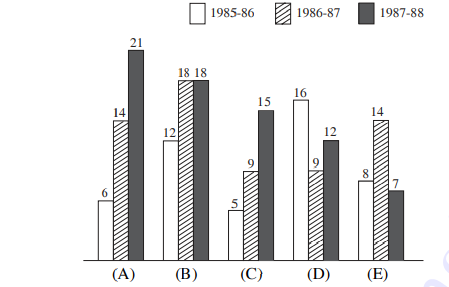
The production of state D in 1986-87 is how many times its production in 1987-88 ?
View SolutionStudy the following graph carefully and answer the questions given below –
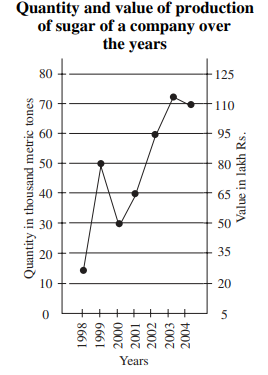
In which of the following years was the value of sugar per metric ton the lowest among the given years?
View SolutionStudy the following graph carefully and answer the questions given below it -----
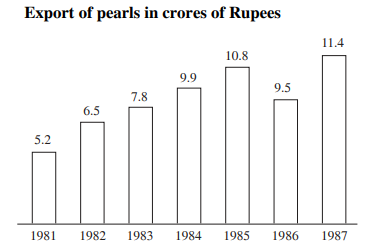
In how many years was the export above the average for the given period ?
View SolutionExamine the following graph carefully and answer the questions given below it :
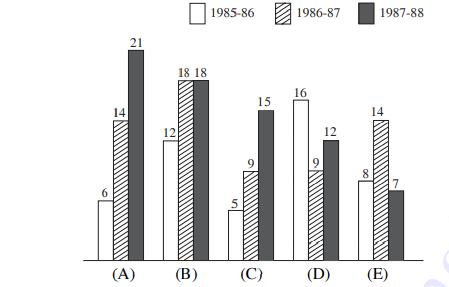
How many tonnes of cotton was produced by state E during the given period ?
View SolutionStudy the following graph carefully and answer the question given below-----
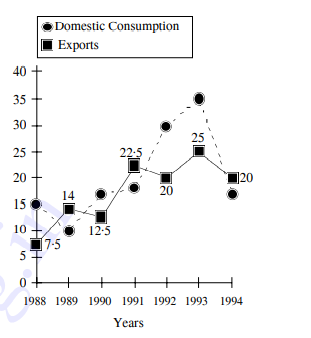
In which of the following years was the value of sugar per metric ton the lowest among the given years ?
View Solution