Give reasons
To draw graphs based on the quantitative information obtained in an experiment, one uses Microsoft Excel.Solution in Marathi
Step by step video & image solution for Give reasons To draw graphs based on the quantitative information obtained in an experiment, one uses Microsoft Excel. by Physics experts to help you in doubts & scoring excellent marks in Class 9 exams.
Updated on:21/07/2023Topper's Solved these Questions
- INFORMATION COMMUNICATION TECHNOLOGY : THE NEW DIRECTION OF PROGRESSBOOK - BAL BHARTICHAPTER - INFORMATION COMMUNICATION TECHNOLOGY : THE NEW DIRECTION OF PROGRESSEXERCISE - EXERCISE (ANSWER THE FOLLOWING QUESTIONS)
5 Videos
- INFORMATION COMMUNICATION TECHNOLOGY : THE NEW DIRECTION OF PROGRESSBOOK - BAL BHARTICHAPTER - INFORMATION COMMUNICATION TECHNOLOGY : THE NEW DIRECTION OF PROGRESSEXERCISE - EXERCISE
3 Videos
- INFORMATION COMMUNICATION TECHNOLOGY : THE NEW DIRECTION OF PROGRESSBOOK - BAL BHARTICHAPTER - INFORMATION COMMUNICATION TECHNOLOGY : THE NEW DIRECTION OF PROGRESSEXERCISE - THINK ABOUT IT
1 Videos
- CURRENT ELECTRICITY BOOK - BAL BHARTICHAPTER - CURRENT ELECTRICITY EXERCISE - Exercises
25 Videos
- LAW OF MOTIONBOOK - BAL BHARTICHAPTER - LAW OF MOTIONEXERCISE - Exercises
18 Videos
Similar Questions
Answer the following
Explain the role and importance of information communication in science and technology.
View SolutionExplain the differences between the different generations of computers. How did science contribute to these developments?
View SolutionHow is information communication technology important for dealing with the explosion of information?
View SolutionAnswer the following question:
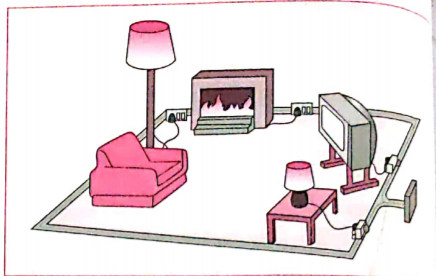
The accompanying figure shows some electrical appliances connected in a circuit in a house.

By which method are the appliances connected?
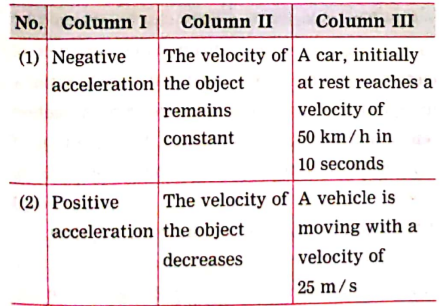
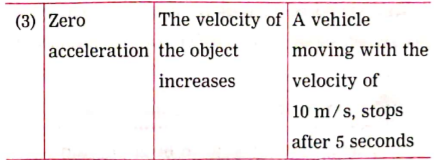
View SolutionMatch the first column with appropriate entries in the second and third columns and remake the table:


View SolutionMicrosoft Office's personal information manager is
View Solutionरासायनिक समीकरण मात्रात्मक जानकारी देती है
View SolutionGive the graph for first order reaction and write the information obtained from it.
View SolutionIn an experiment of verification of Ohm's law, following observations are obtained.

Draw a V-I graph and use this graph to find :
the resistance in circuit.
View SolutionA database used by Microsoft Windows for storing configuration information is known as:
View SolutionWhich of the following symbols must be used before a formula in a Microsoft Excel sheet?
View SolutionOdd one out
Microsoft Word, Microsoft Excel, Microsoft Powerpoint, CPU
View SolutionGive reasons
To draw graphs based on the quantitative information obtained in an experiment, one uses Microsoft Excel.
View SolutionAnswer the following.
Write important features of Microsoft Excel.
View SolutionAnswer the following.
Mention precautions to be taken while entering data in Microsoft Excel.
View SolutionMicrosoft excel is also called ______
View Solution
