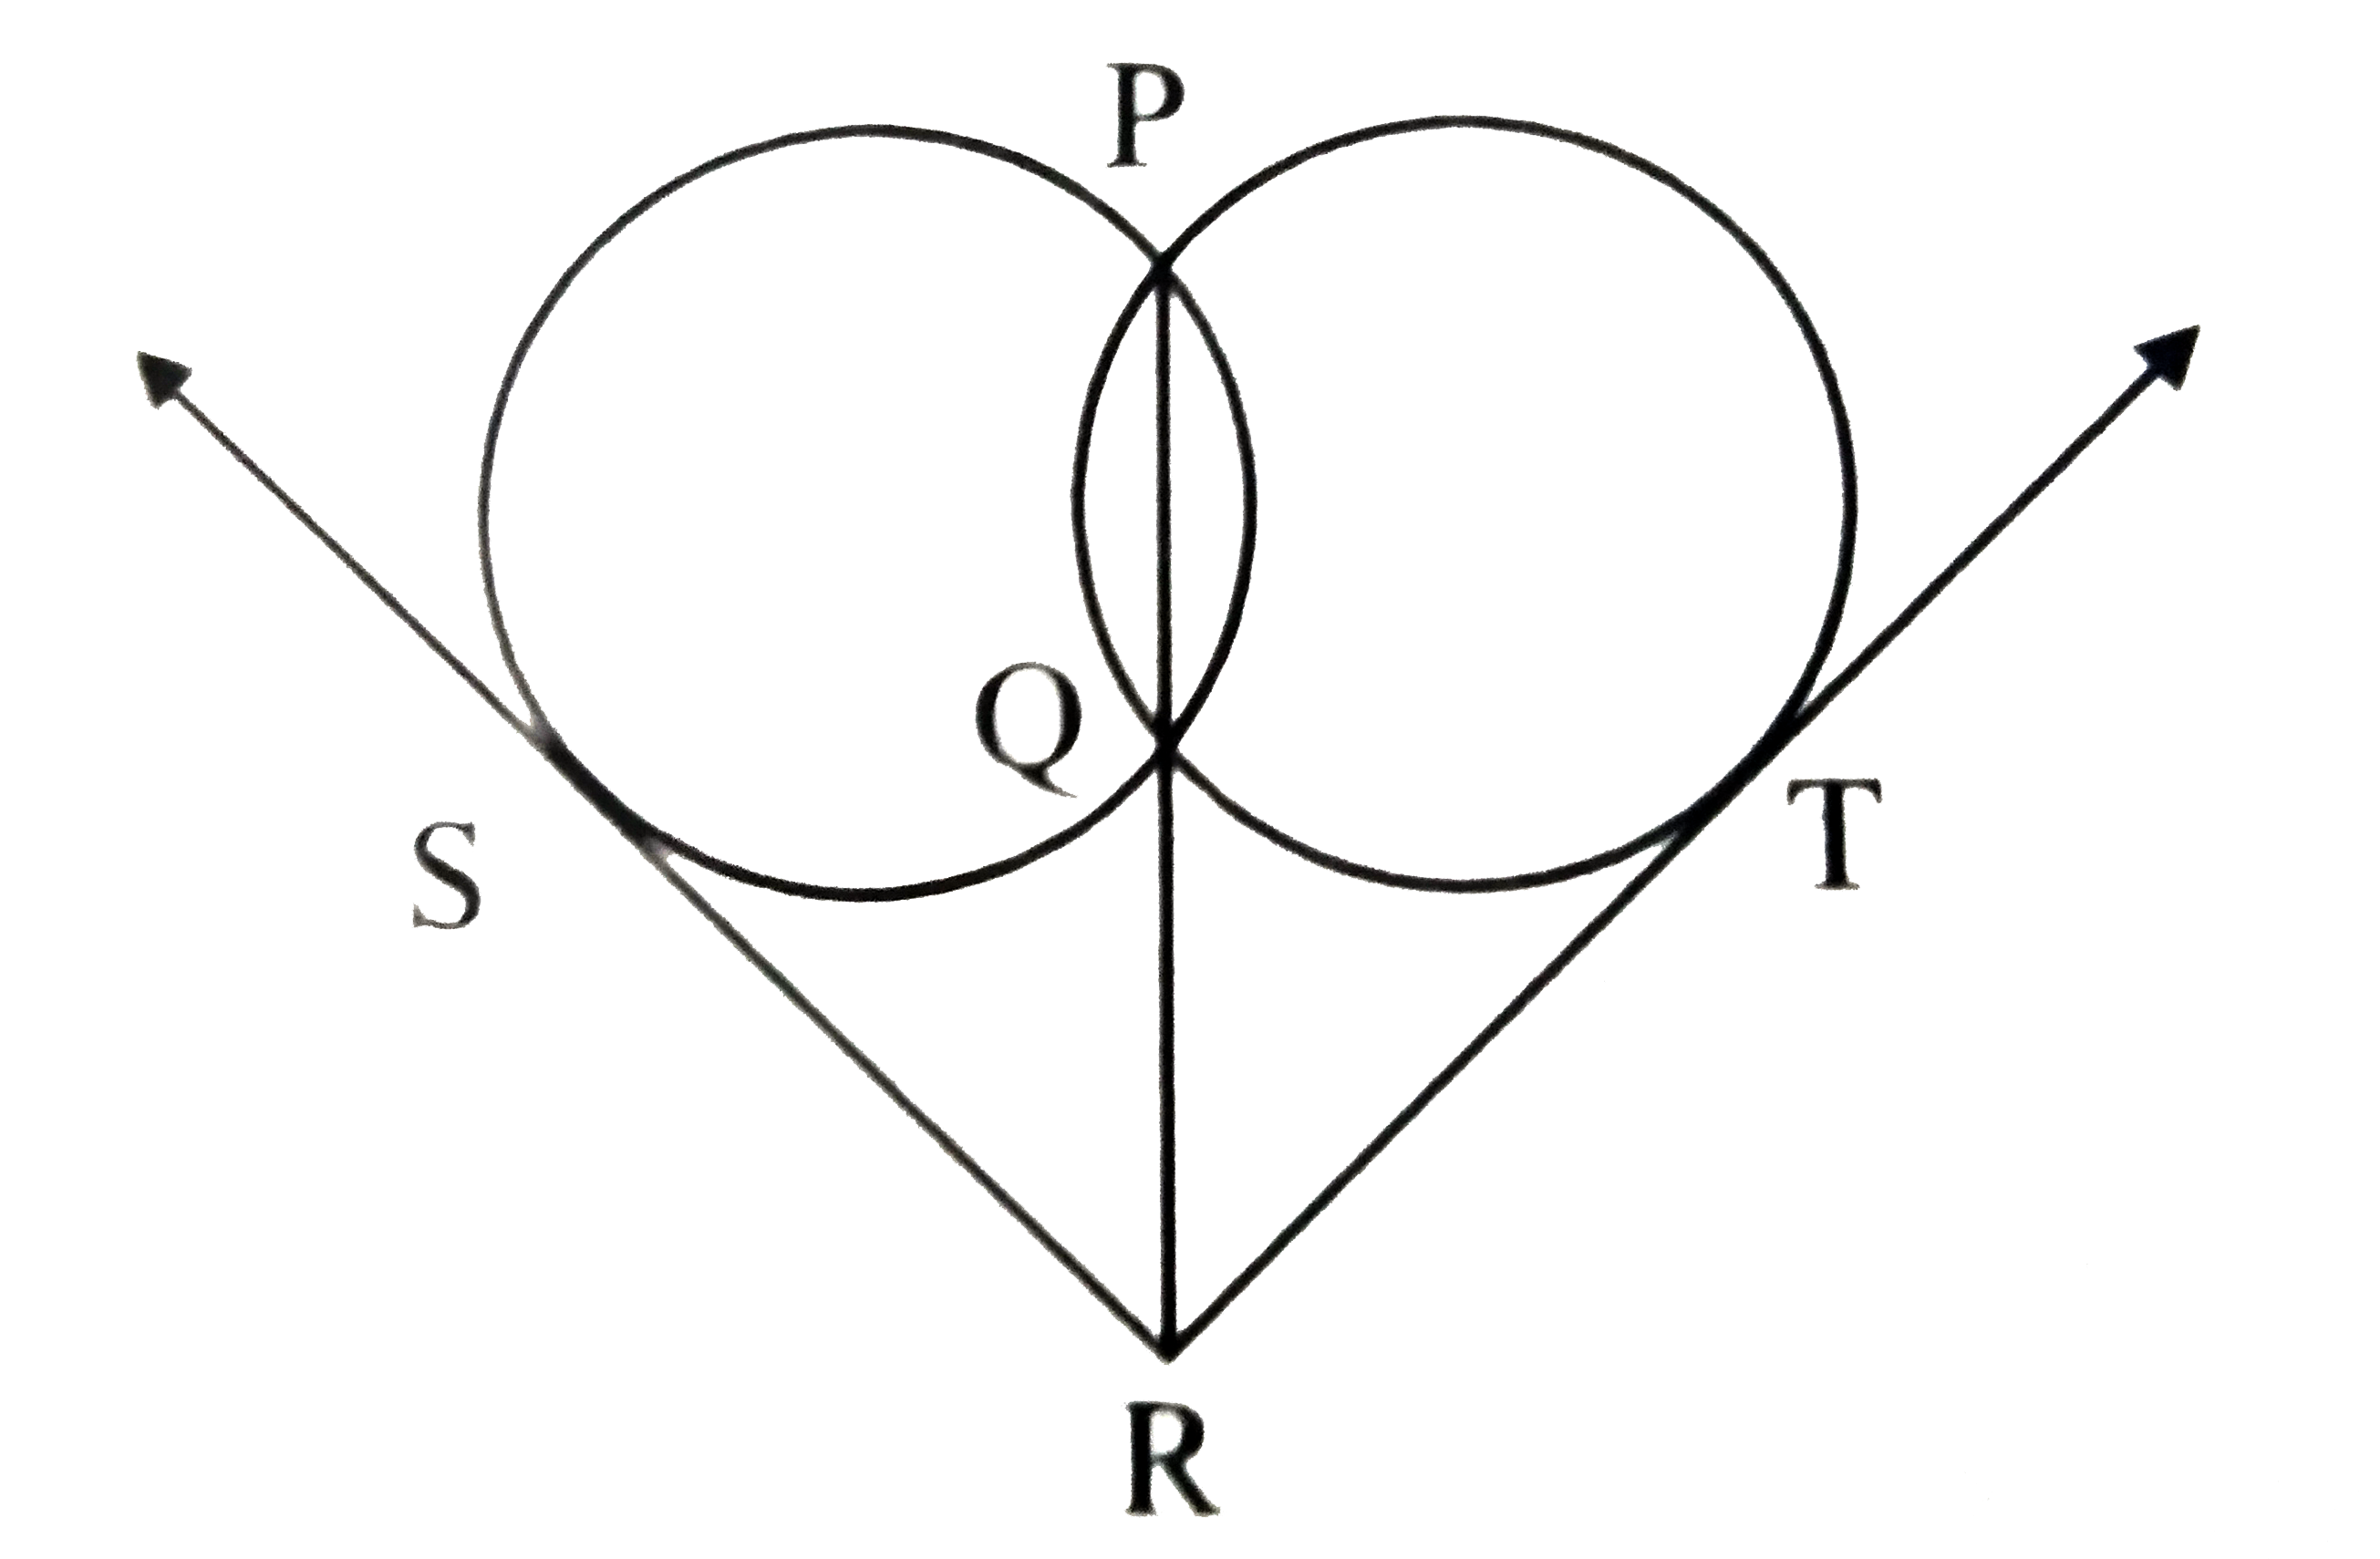
In the figure, two circles intersect each other in points P and Q. If tangent from point R touch the circles at S and T, then prove that RS=RT.
 Solution in Marathi
Step by step video solution for In the figure, two circles intersect each other in points P and Q. If tangent from point R touch the circles at S and T, then prove that RS=RT. by Maths experts to help you in doubts & scoring excellent marks in Class 10 exams.
Updated on:21/07/2023Topper's Solved these Questions
- CIRCLE BOOK - BAL BHARTICHAPTER - CIRCLE EXERCISE - PRACTICE SET 3.1
2 Videos
- CIRCLE BOOK - BAL BHARTICHAPTER - CIRCLE EXERCISE - PRACTICE SET 3.2
4 Videos
- ARITHMETIC PROGRESSION BOOK - BAL BHARTICHAPTER - ARITHMETIC PROGRESSION EXERCISE - PROBLEM SET - 3
13 Videos
- CO-ORDINATE GEOMETRYBOOK - BAL BHARTICHAPTER - CO-ORDINATE GEOMETRYEXERCISE - Problem set 5
27 Videos
Similar Questions
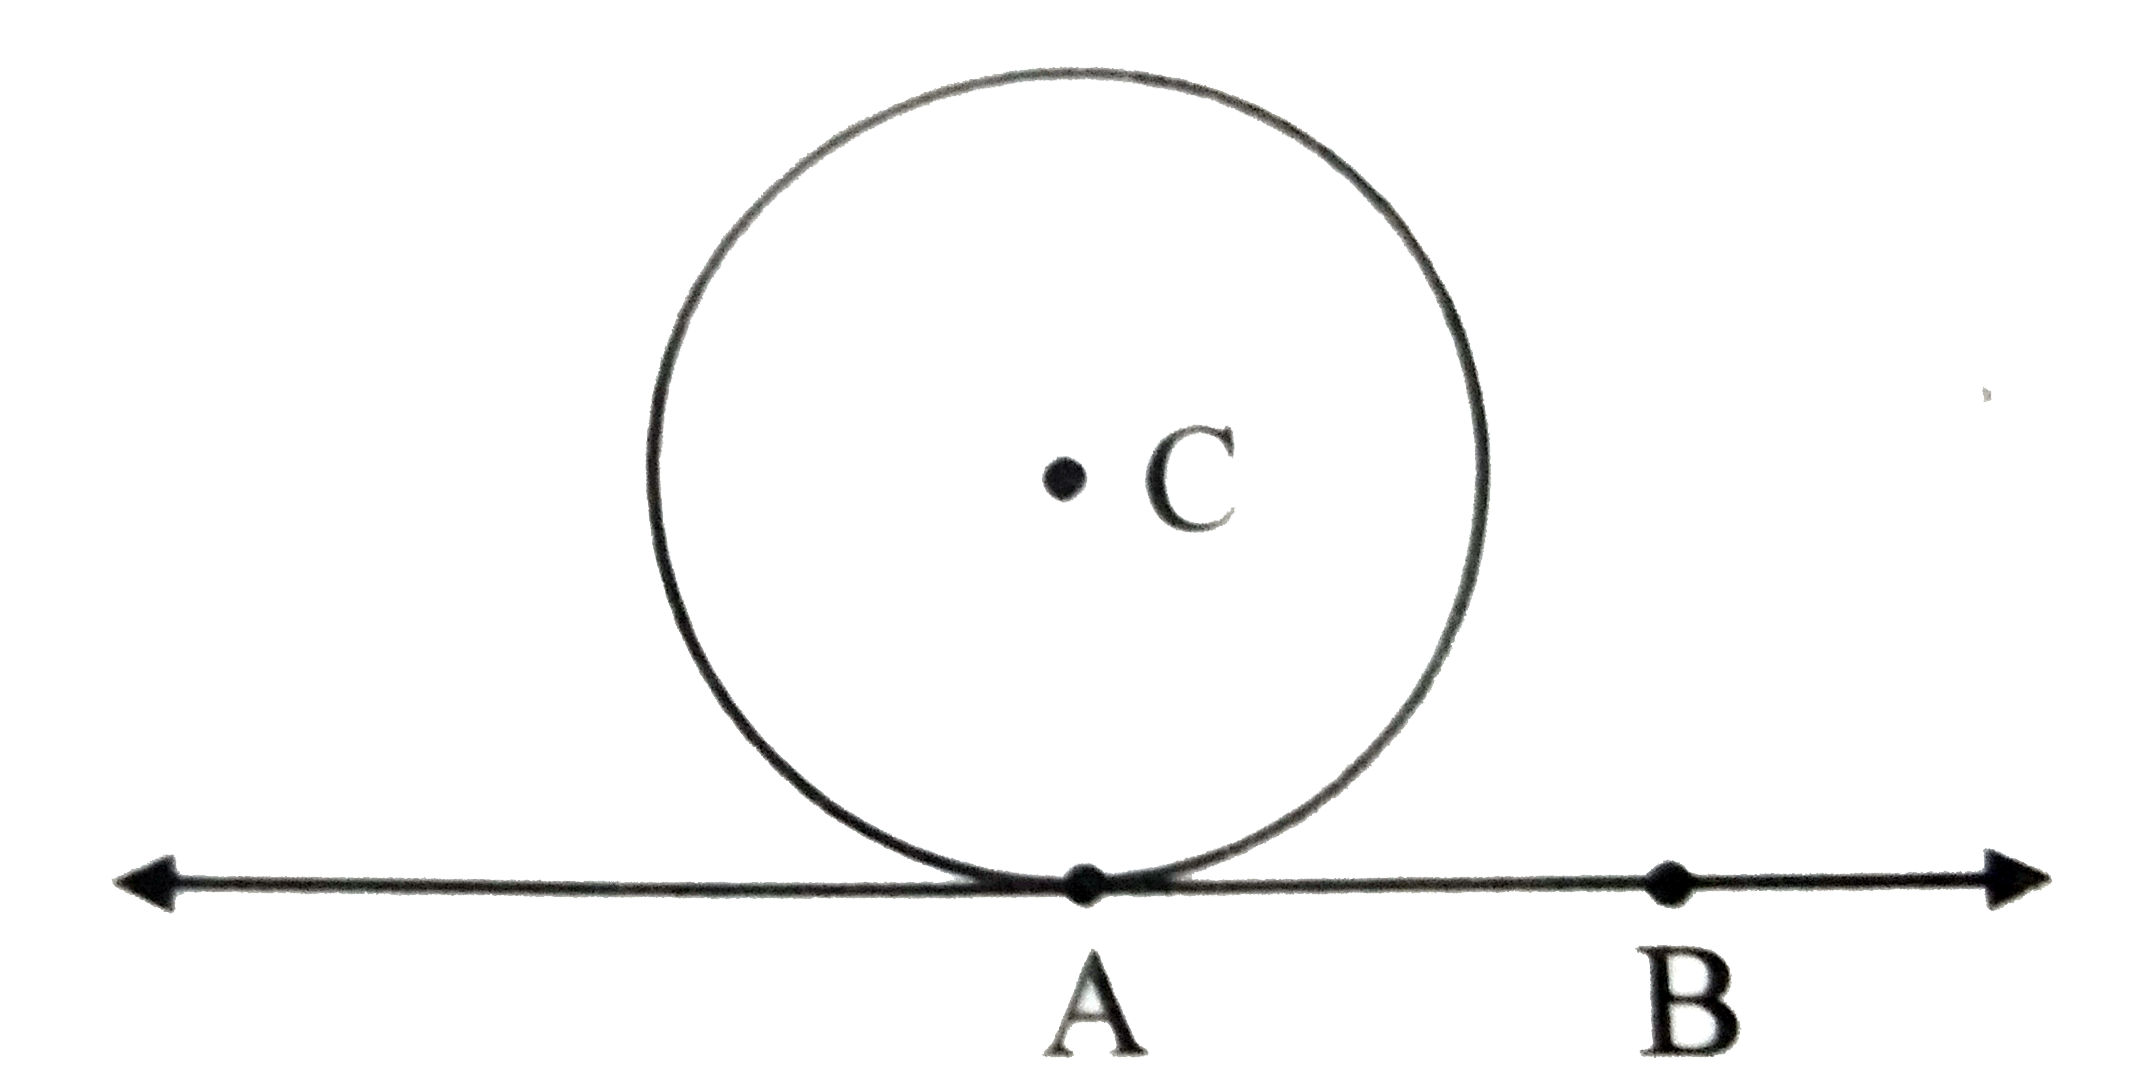
In the adjoining figure, the radius of a circle with centre C is 6cm,
line AB is a tangent at A. Answer the following question
(i) What is the measure of ∠CAB? Why?
(ii) What is the distance of point C from line AB? Why?
(iii) d(A,B)=6cm, find d(B,C).
(iv) What is the measure of ∠ABC ? Why?

View SolutionTwo circles having radii 3.5 cm and 4.8 cm touch each other internally.Find the distance between their centres.

View SolutionFind the 4th term from the end in an A.P, −11,−8,−5,….,49
View SolutionDetermine whether the given points are collinear.(i) A(0,2),B(1,-0.5),C(2,-3)
View SolutionHow many lines of symmetry does the above figure have ?
View SolutionDetermine the point of symmetry of a regular hexagon.
View SolutionDtermine the images of the following figure about the given line :
View SolutionMatch the following Column A to Column B

View SolutionMatch the following Column A to Column B

View SolutionMatch the following Column A to Column B

View SolutionFind the area of the figure given below.

View SolutionThe area of the shaded part in the figure given below is ______.

View SolutionThe inequation represented by the graph given below is :
View SolutionThe inequation that best describes the graph given below is _________
View SolutionThe inequation that best describes the following graph is _________
View SolutionWhich inequations represent the shaded region in the given figure
View Solution
