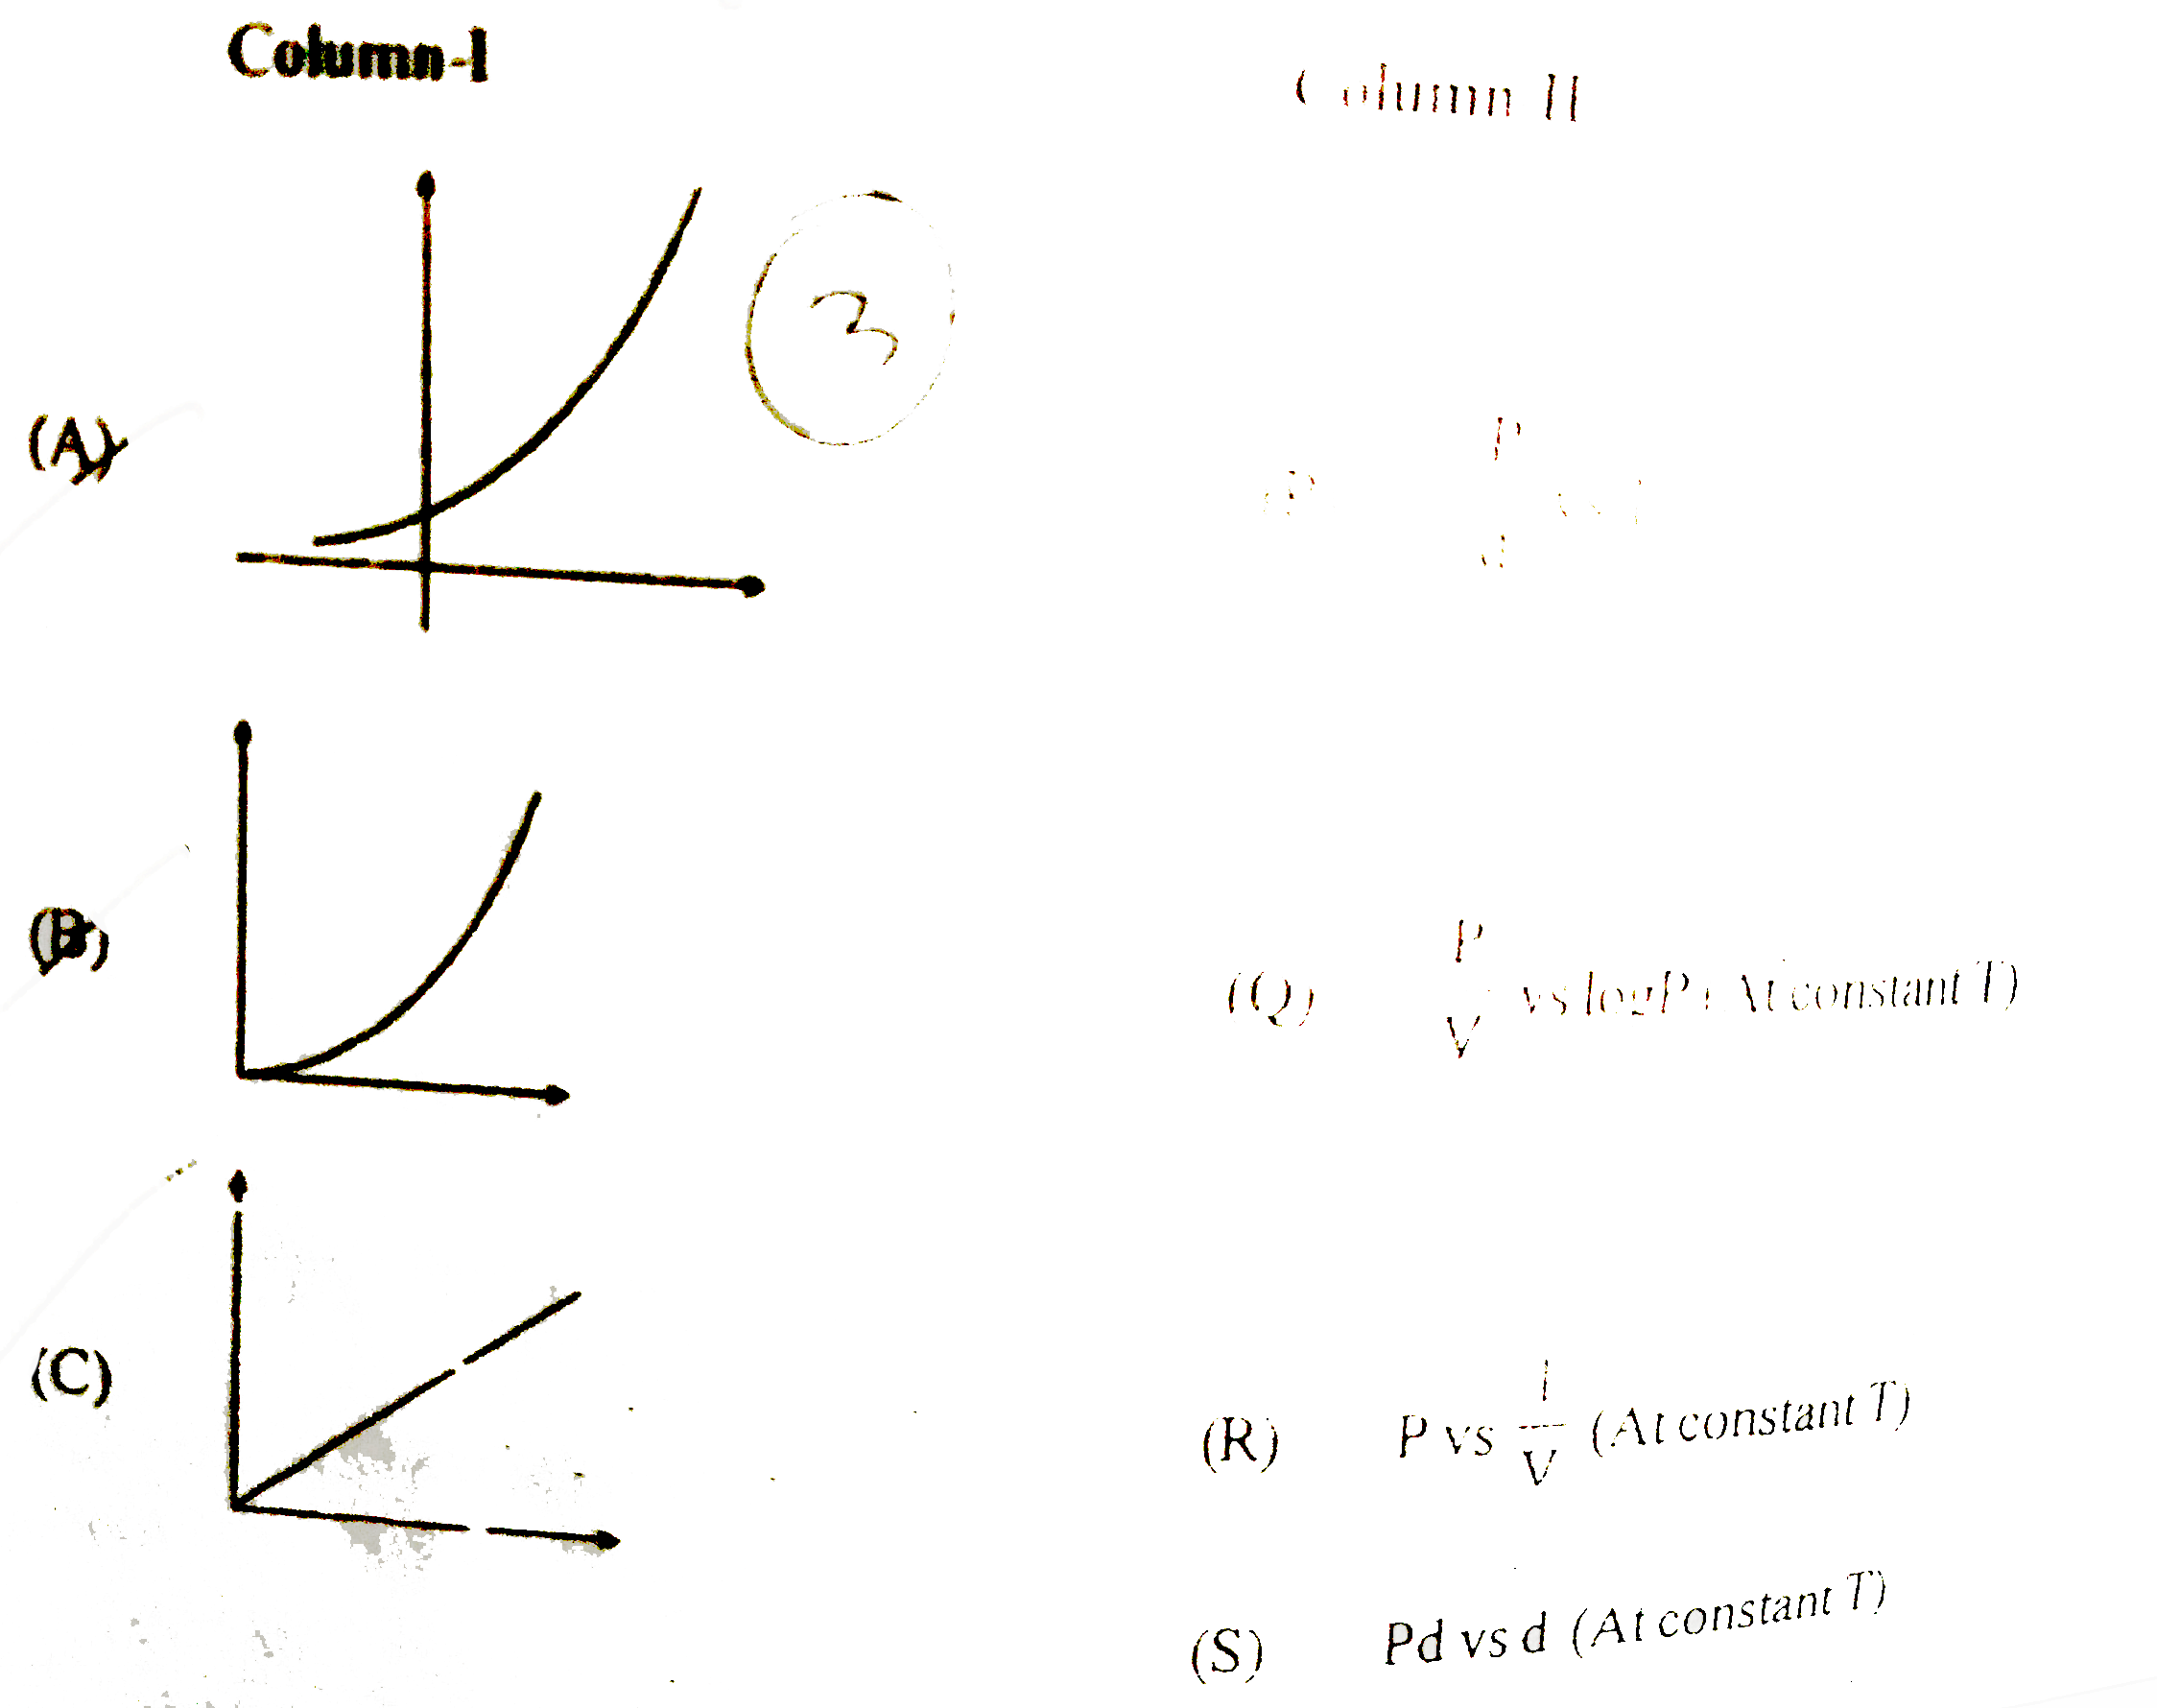
Which of the following diagrams correctly describes the behaviour of a fixed mass of an ideal gas ? (T is measured in K)
A
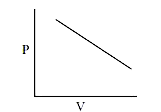
B
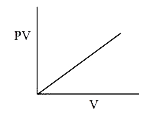
C
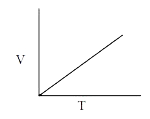
D
All of these
Text Solution
The correct Answer is:C
For a fixed mass of an ideal gas VαT
Pα1/VandPV= Constant
|
Topper's Solved these Questions
- GASEOUS STATEBOOK - NCERT TAMILCHAPTER - GASEOUS STATEEXERCISE - EVALUATION (Answer these questions briefly)
10 Videos
- GASEOUS STATEBOOK - NCERT TAMILCHAPTER - GASEOUS STATEEXERCISE - Evaluate Yourself
9 Videos
- FUNDAMENTALS OF ORGANIC CHEMISTRYBOOK - NCERT TAMILCHAPTER - FUNDAMENTALS OF ORGANIC CHEMISTRYEXERCISE - EVALUATION
59 Videos
- GENERAL INTRODUCTION TO METALLURGYBOOK - NCERT TAMILCHAPTER - GENERAL INTRODUCTION TO METALLURGYEXERCISE - QUESTIONS (EXPLAIN BRIEFLY ON THE FOLLOWING)
10 Videos
Similar Questions
Knowledge Check
Which of the following diagram correctly describes the behaviour of a fixed mass of an ideal gas ? (T is measured in K)
A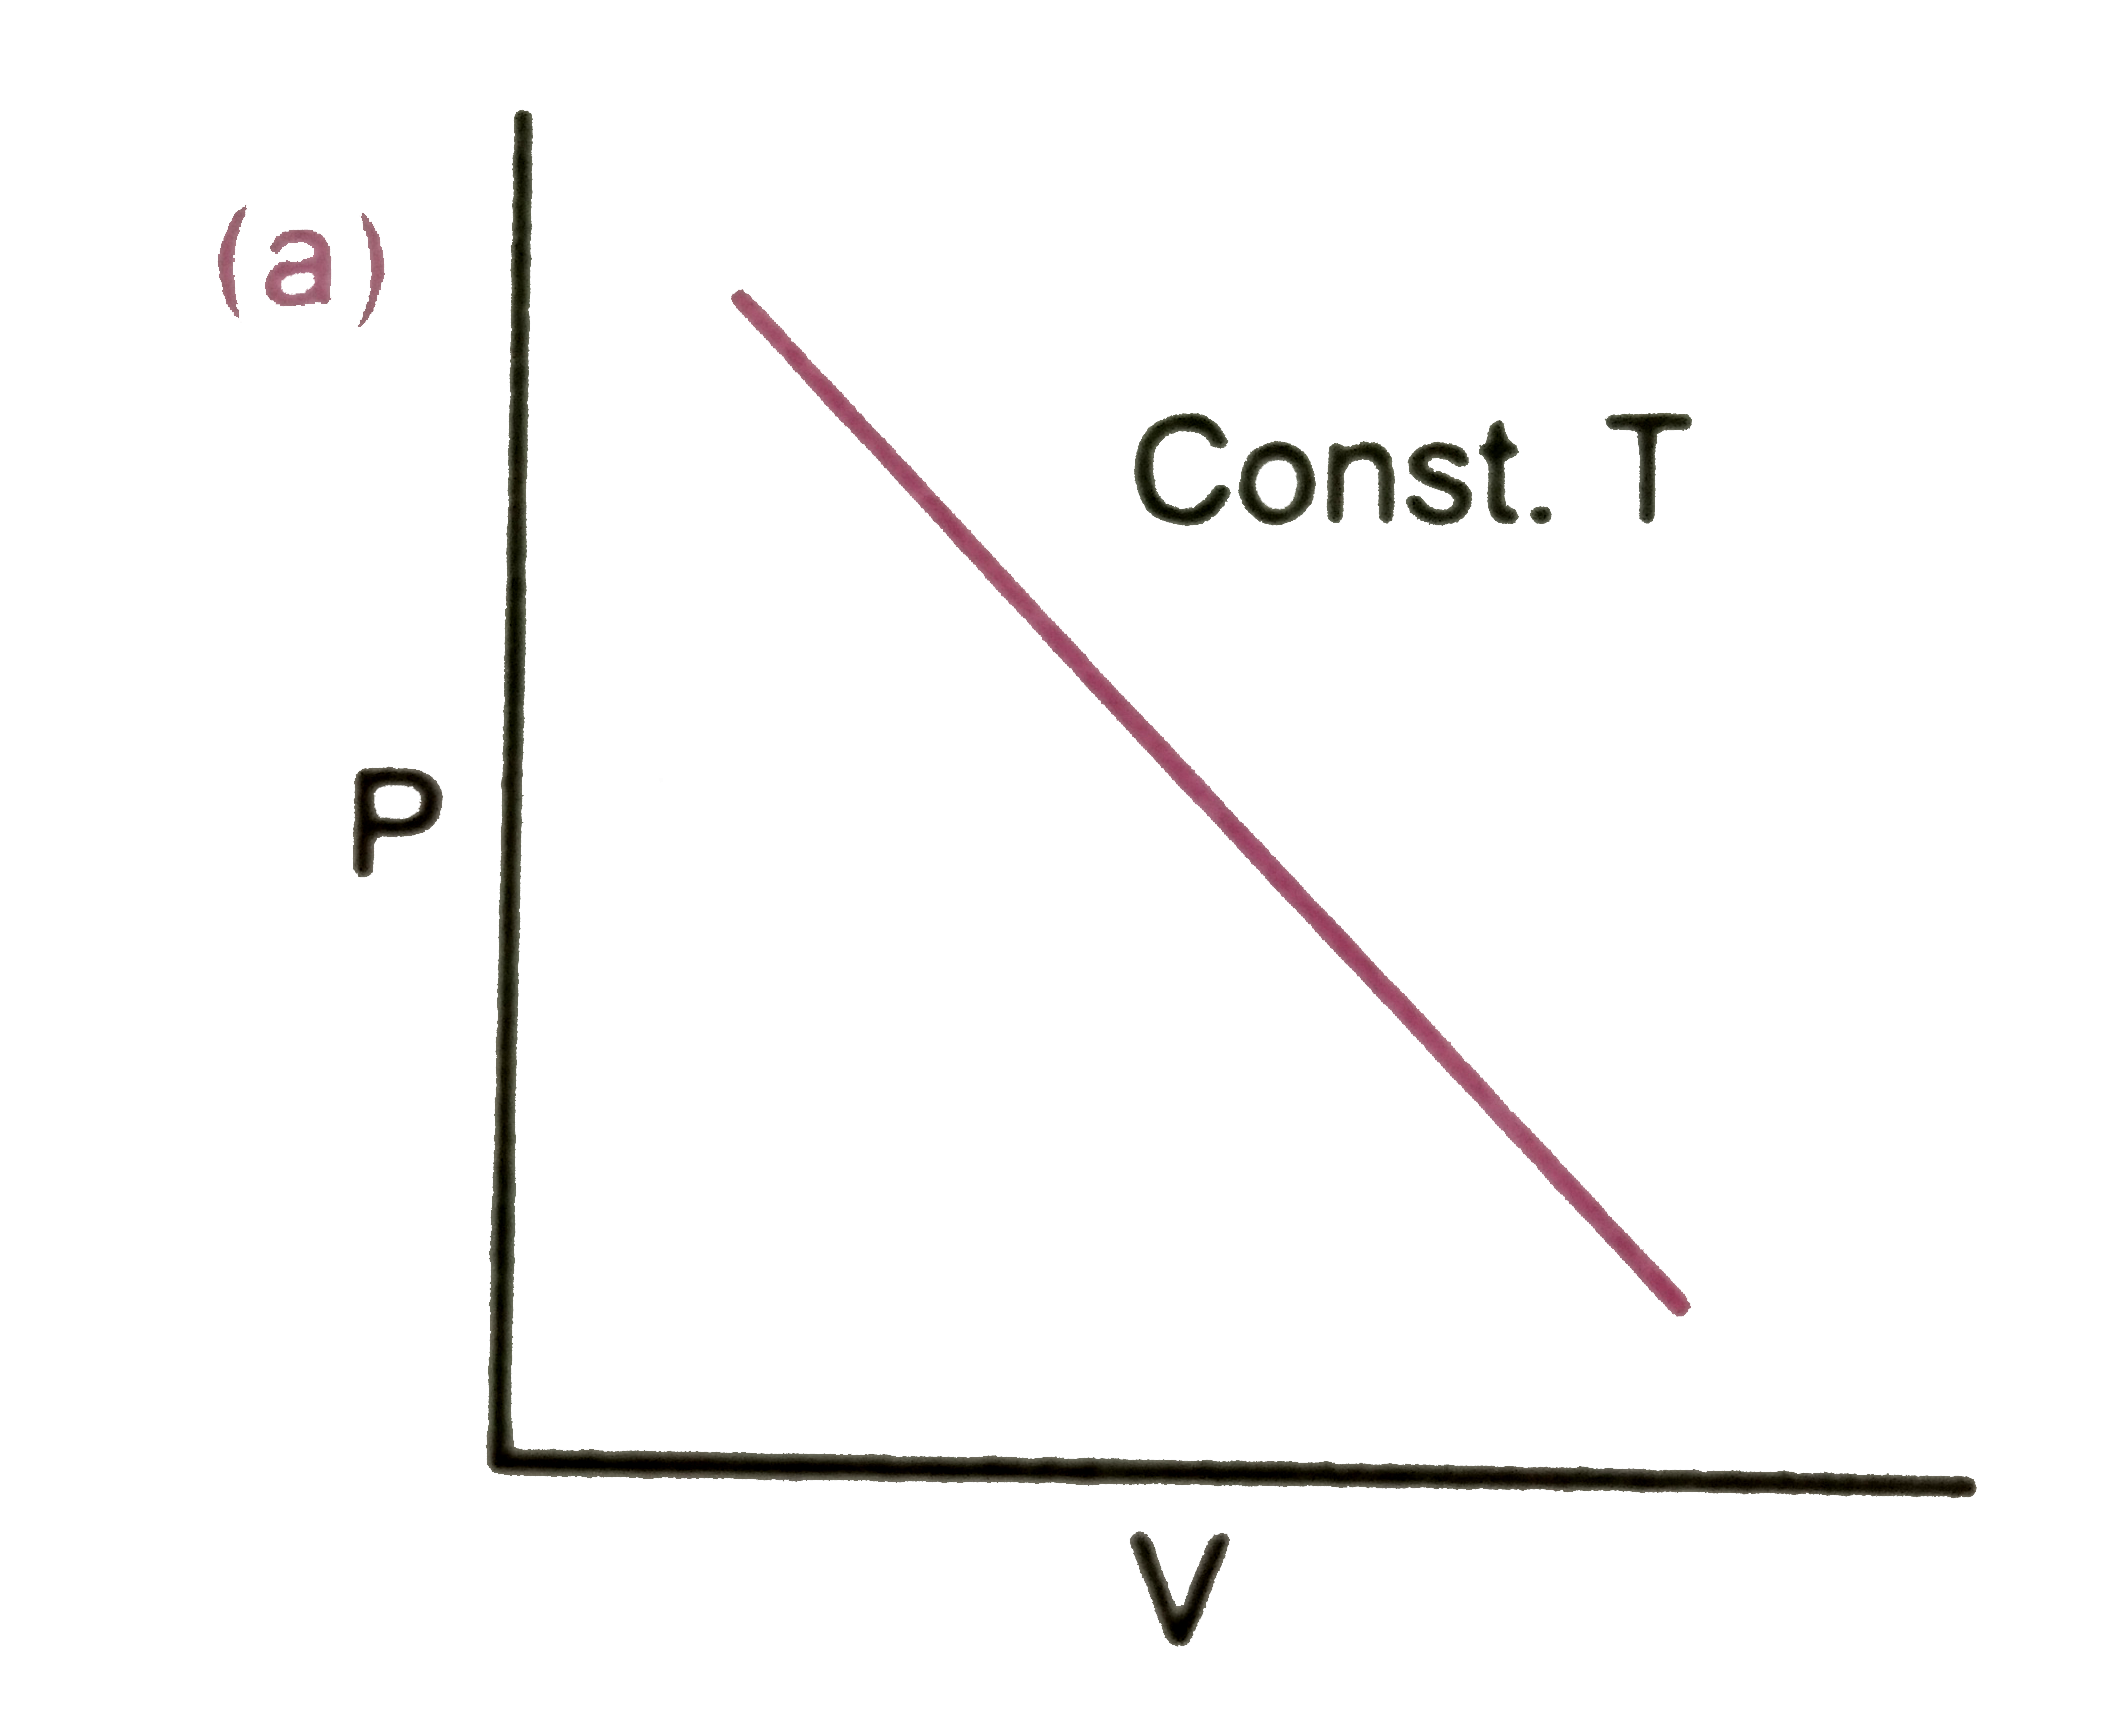 B
B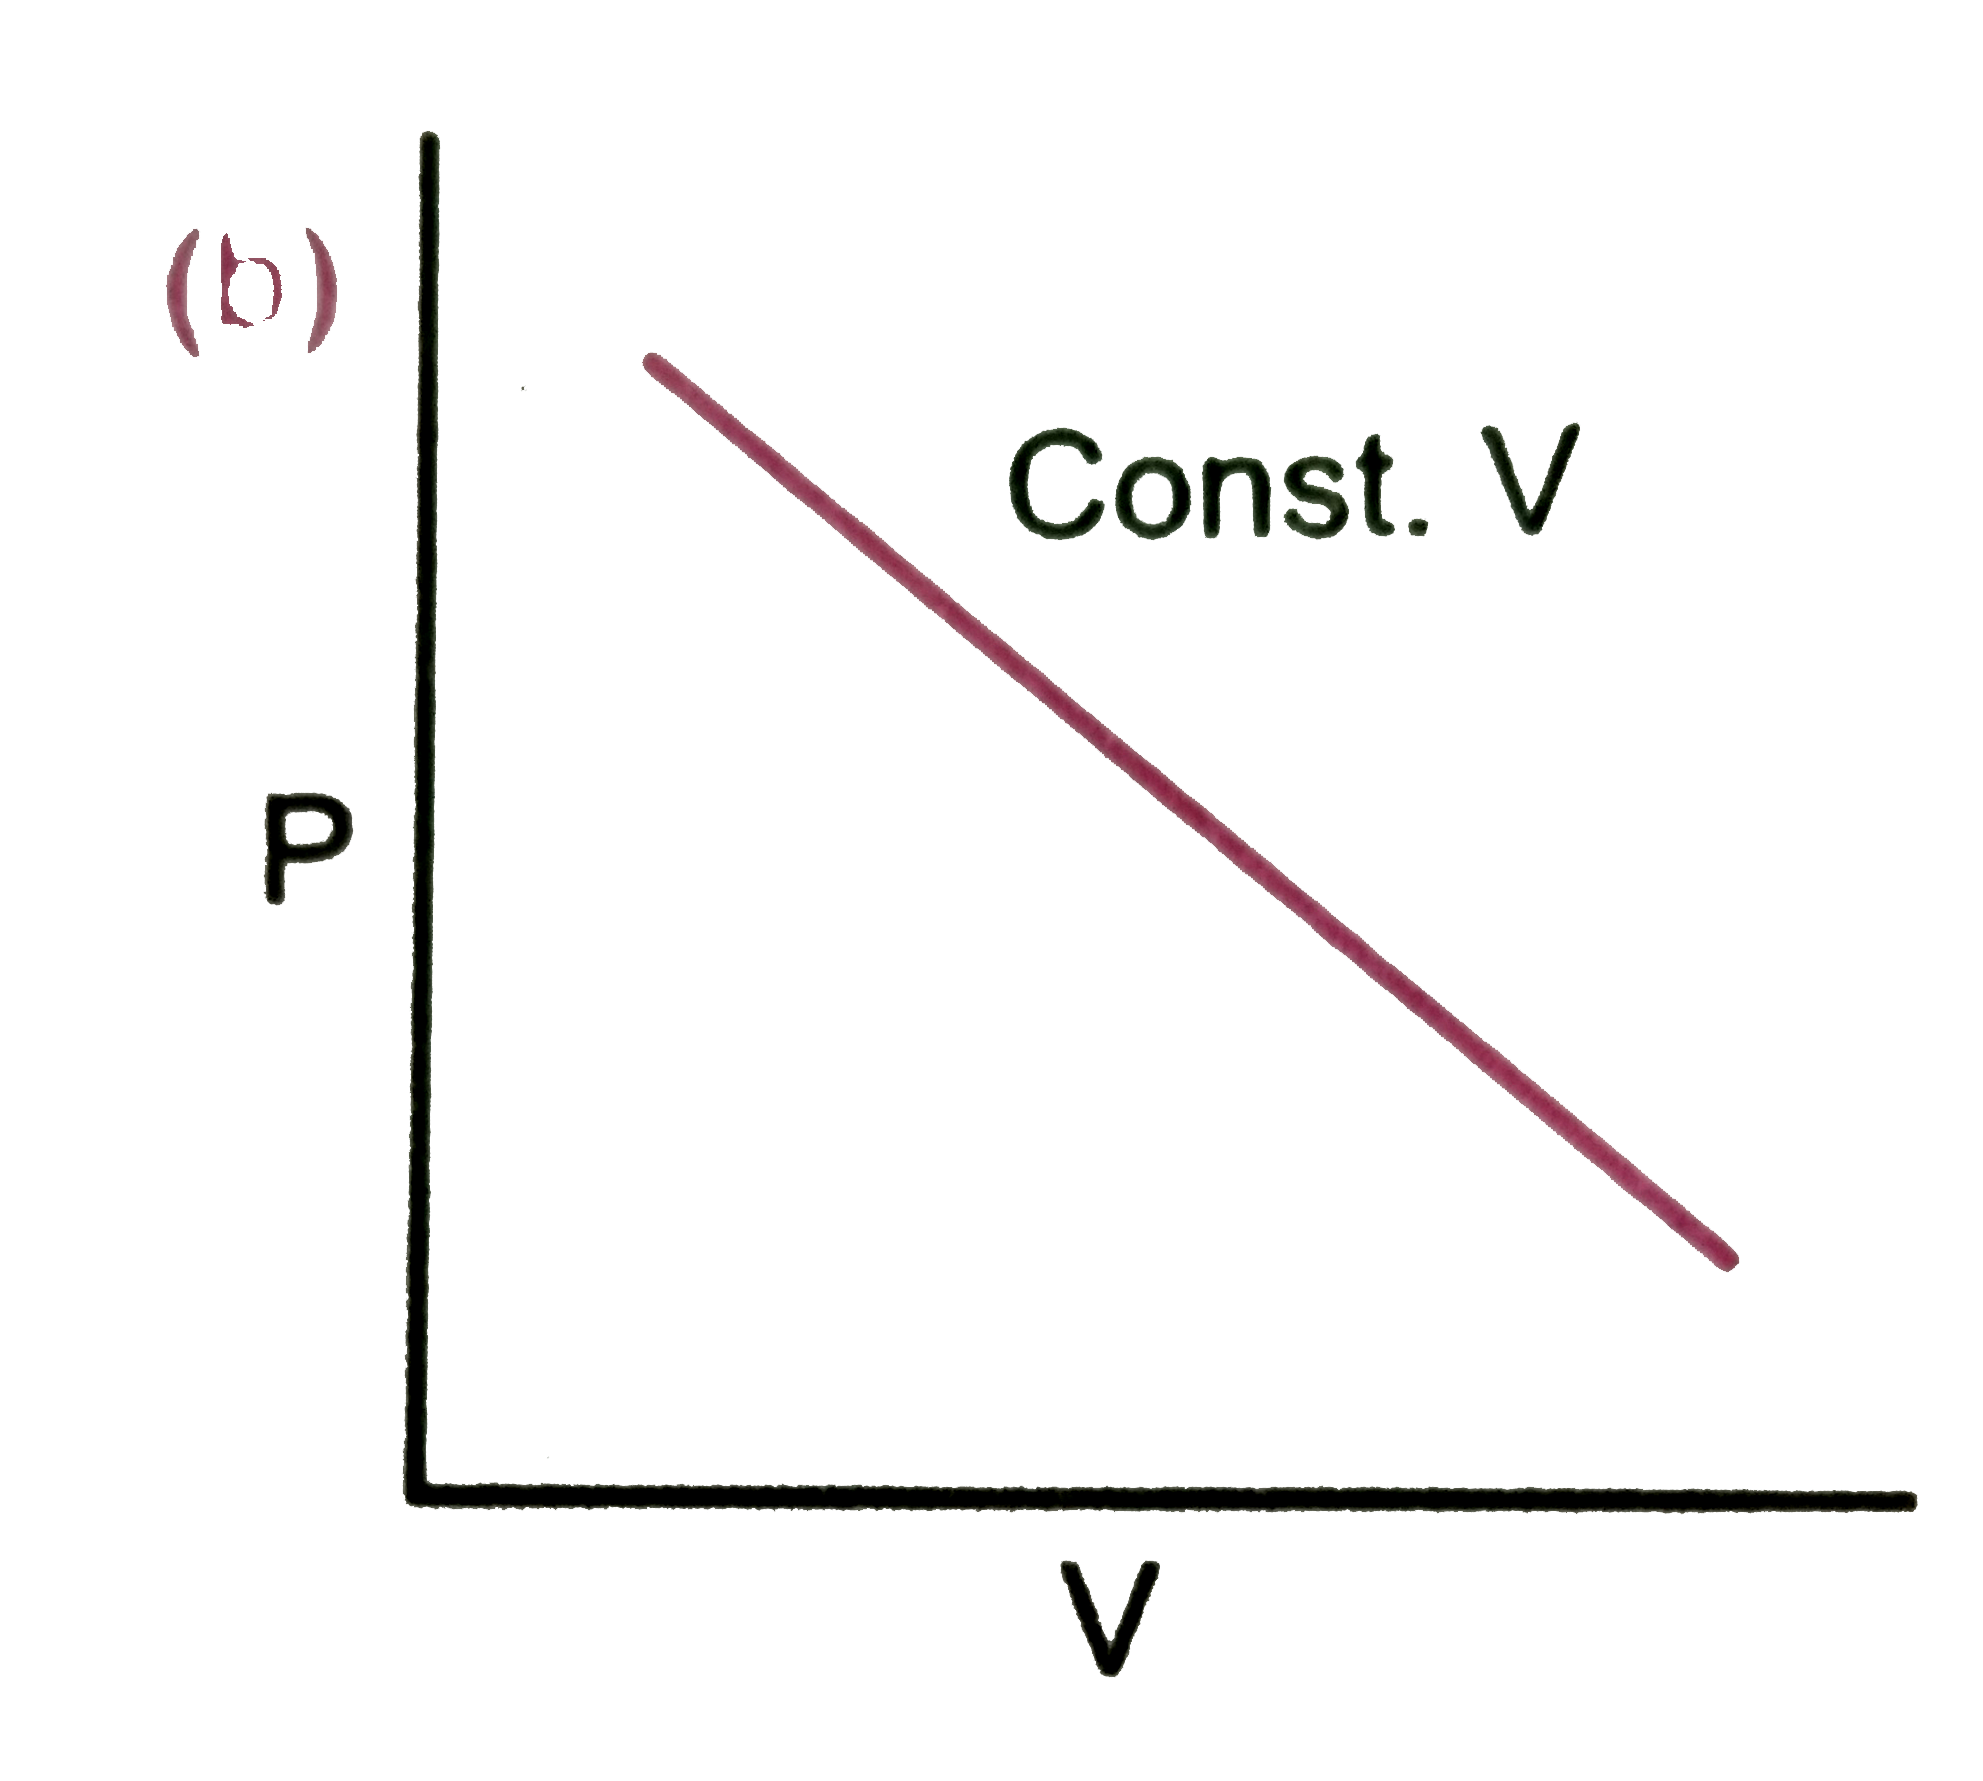 C
C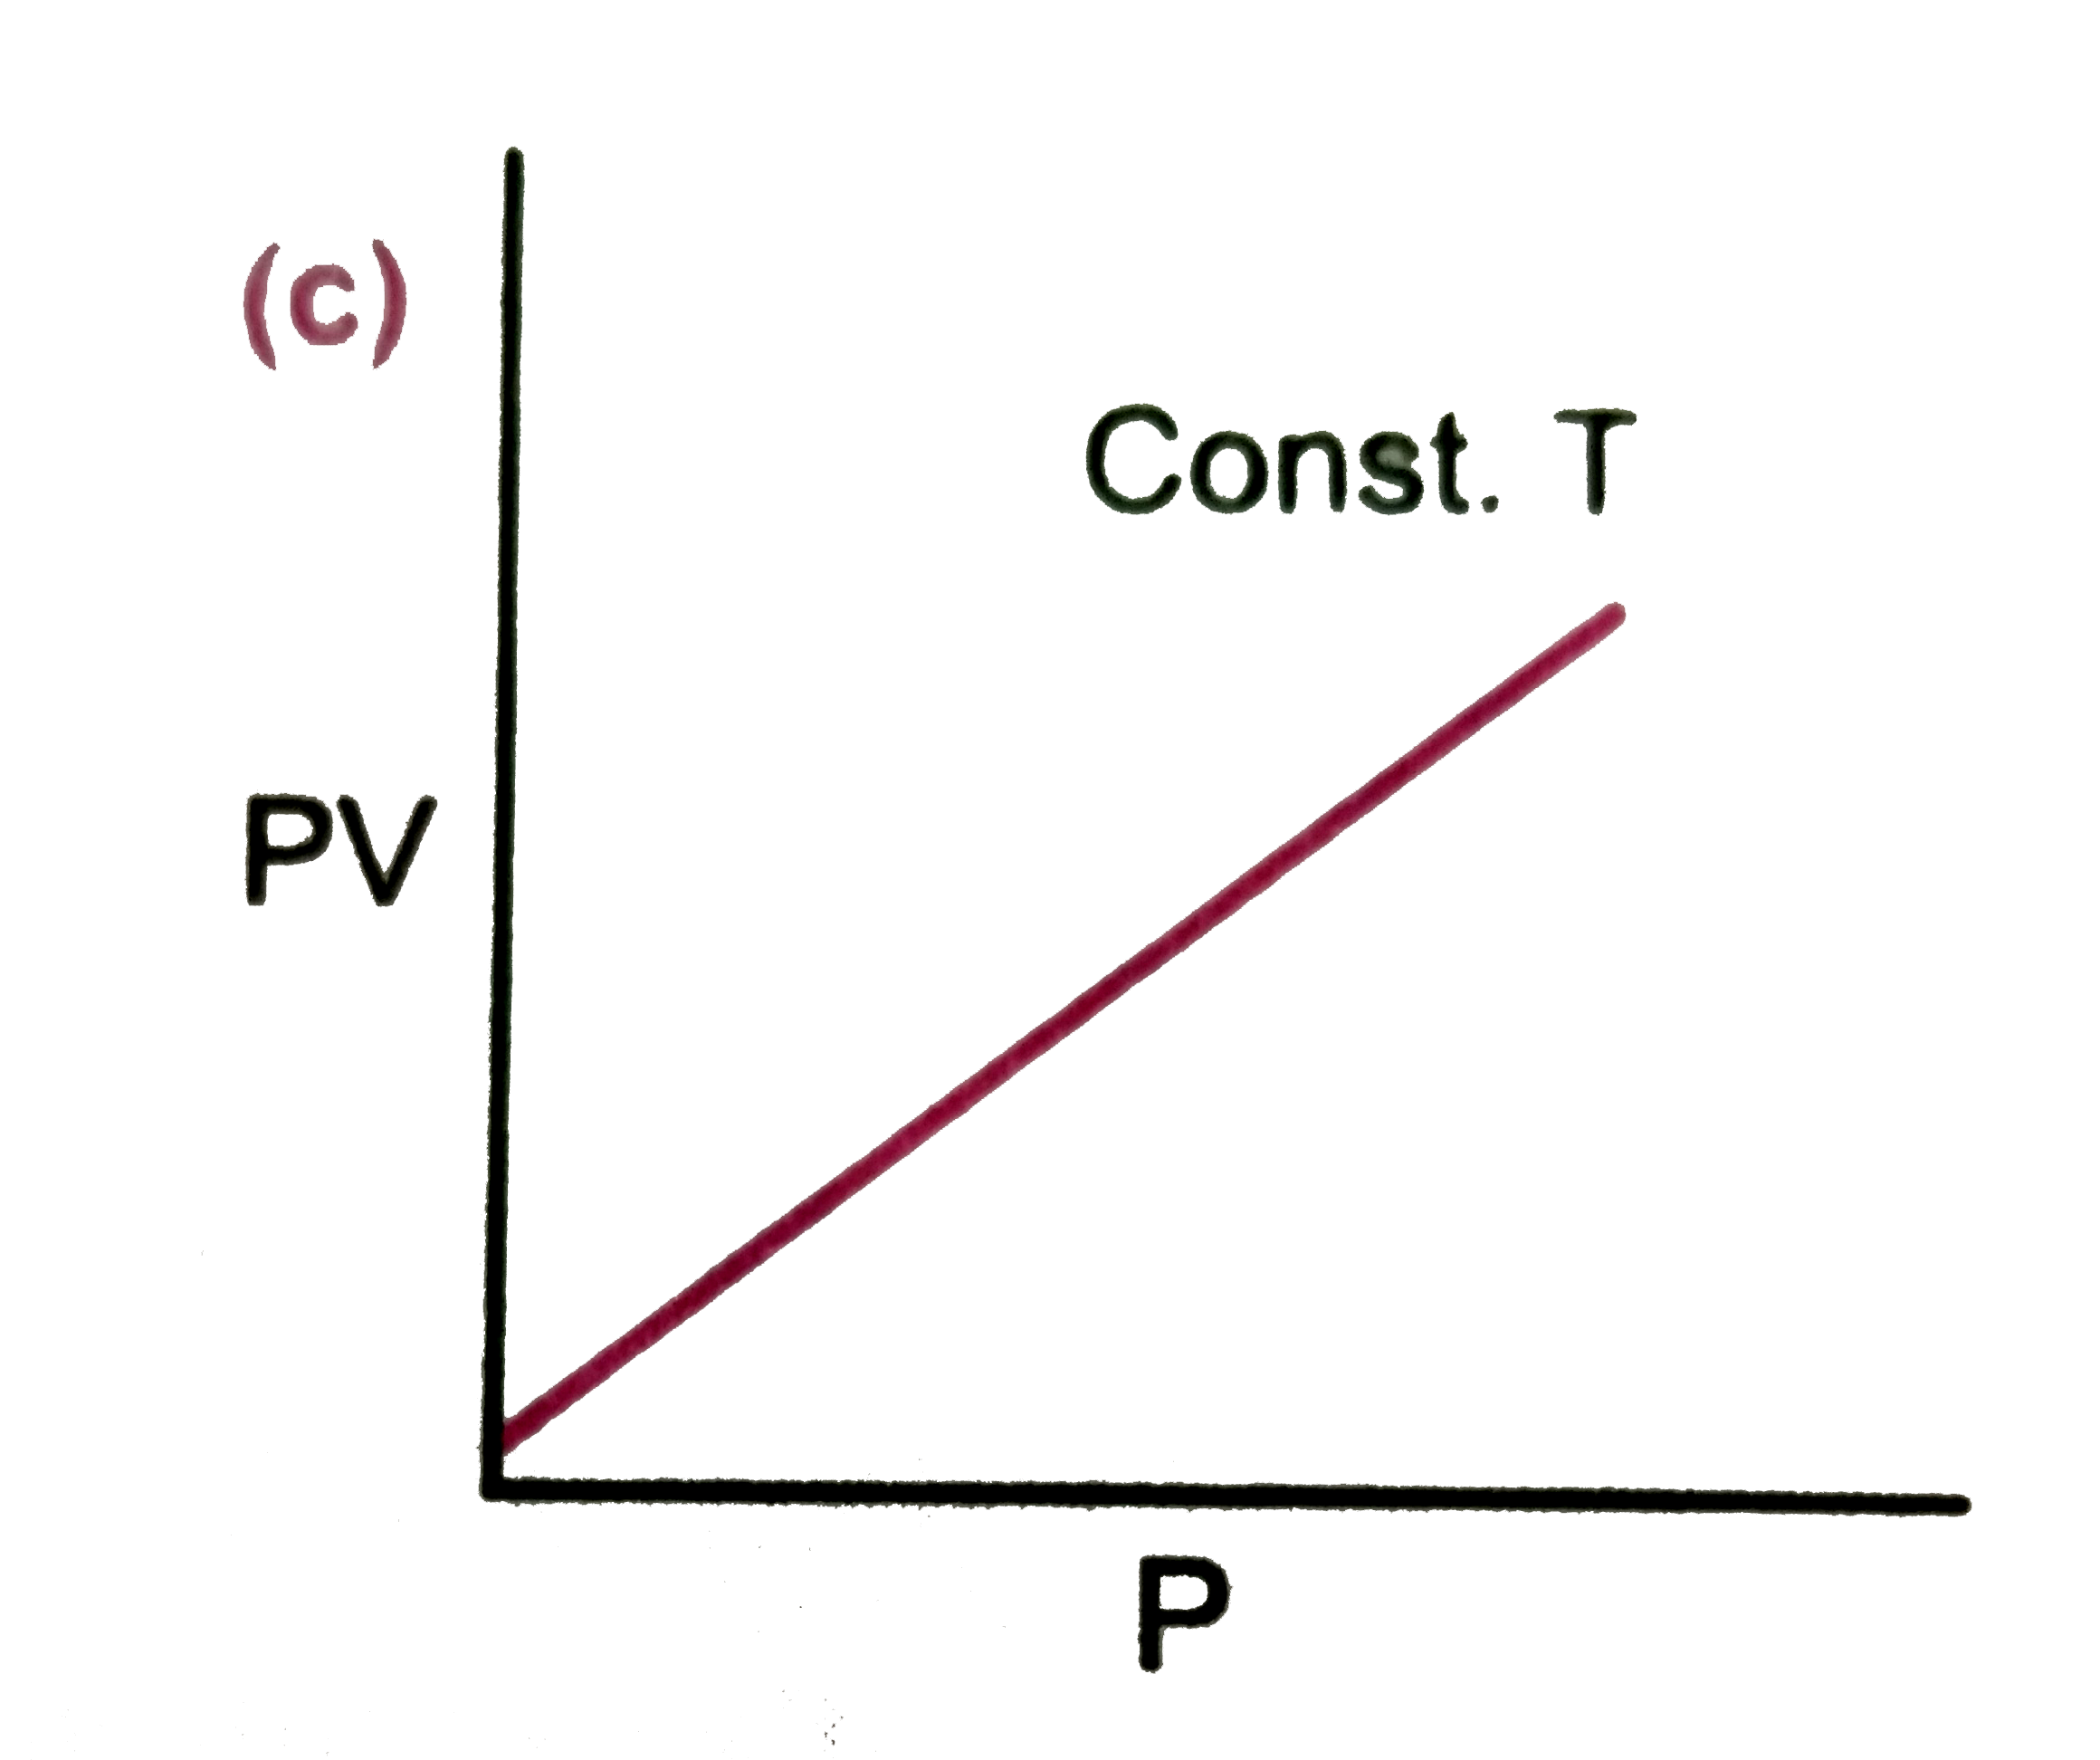 D
D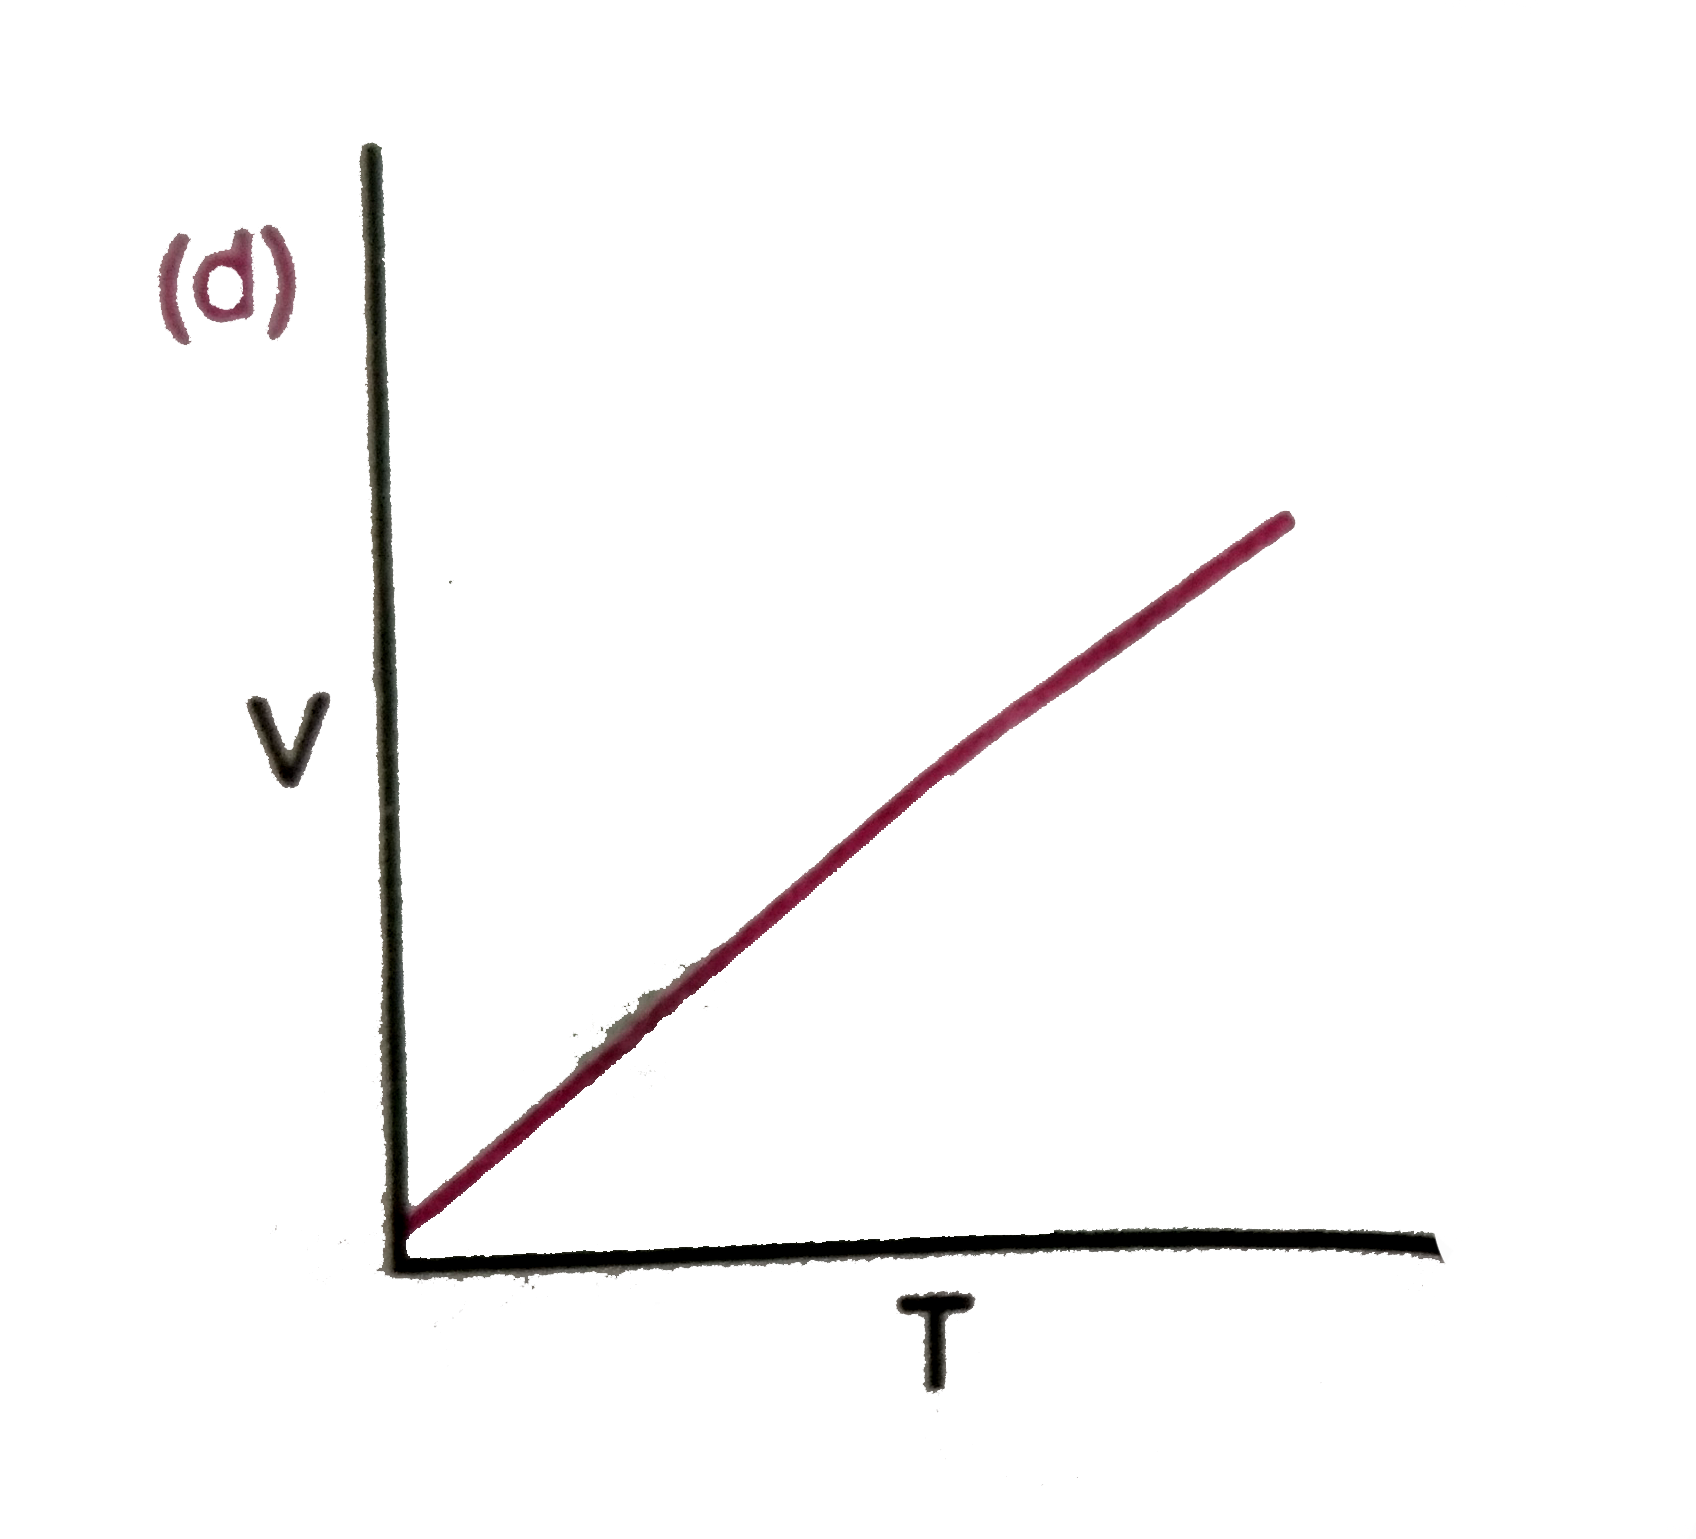
Which of the following diagrams correctly decribes the behavior of a fixed mass of an ideal gas ? (T is measured in K)
A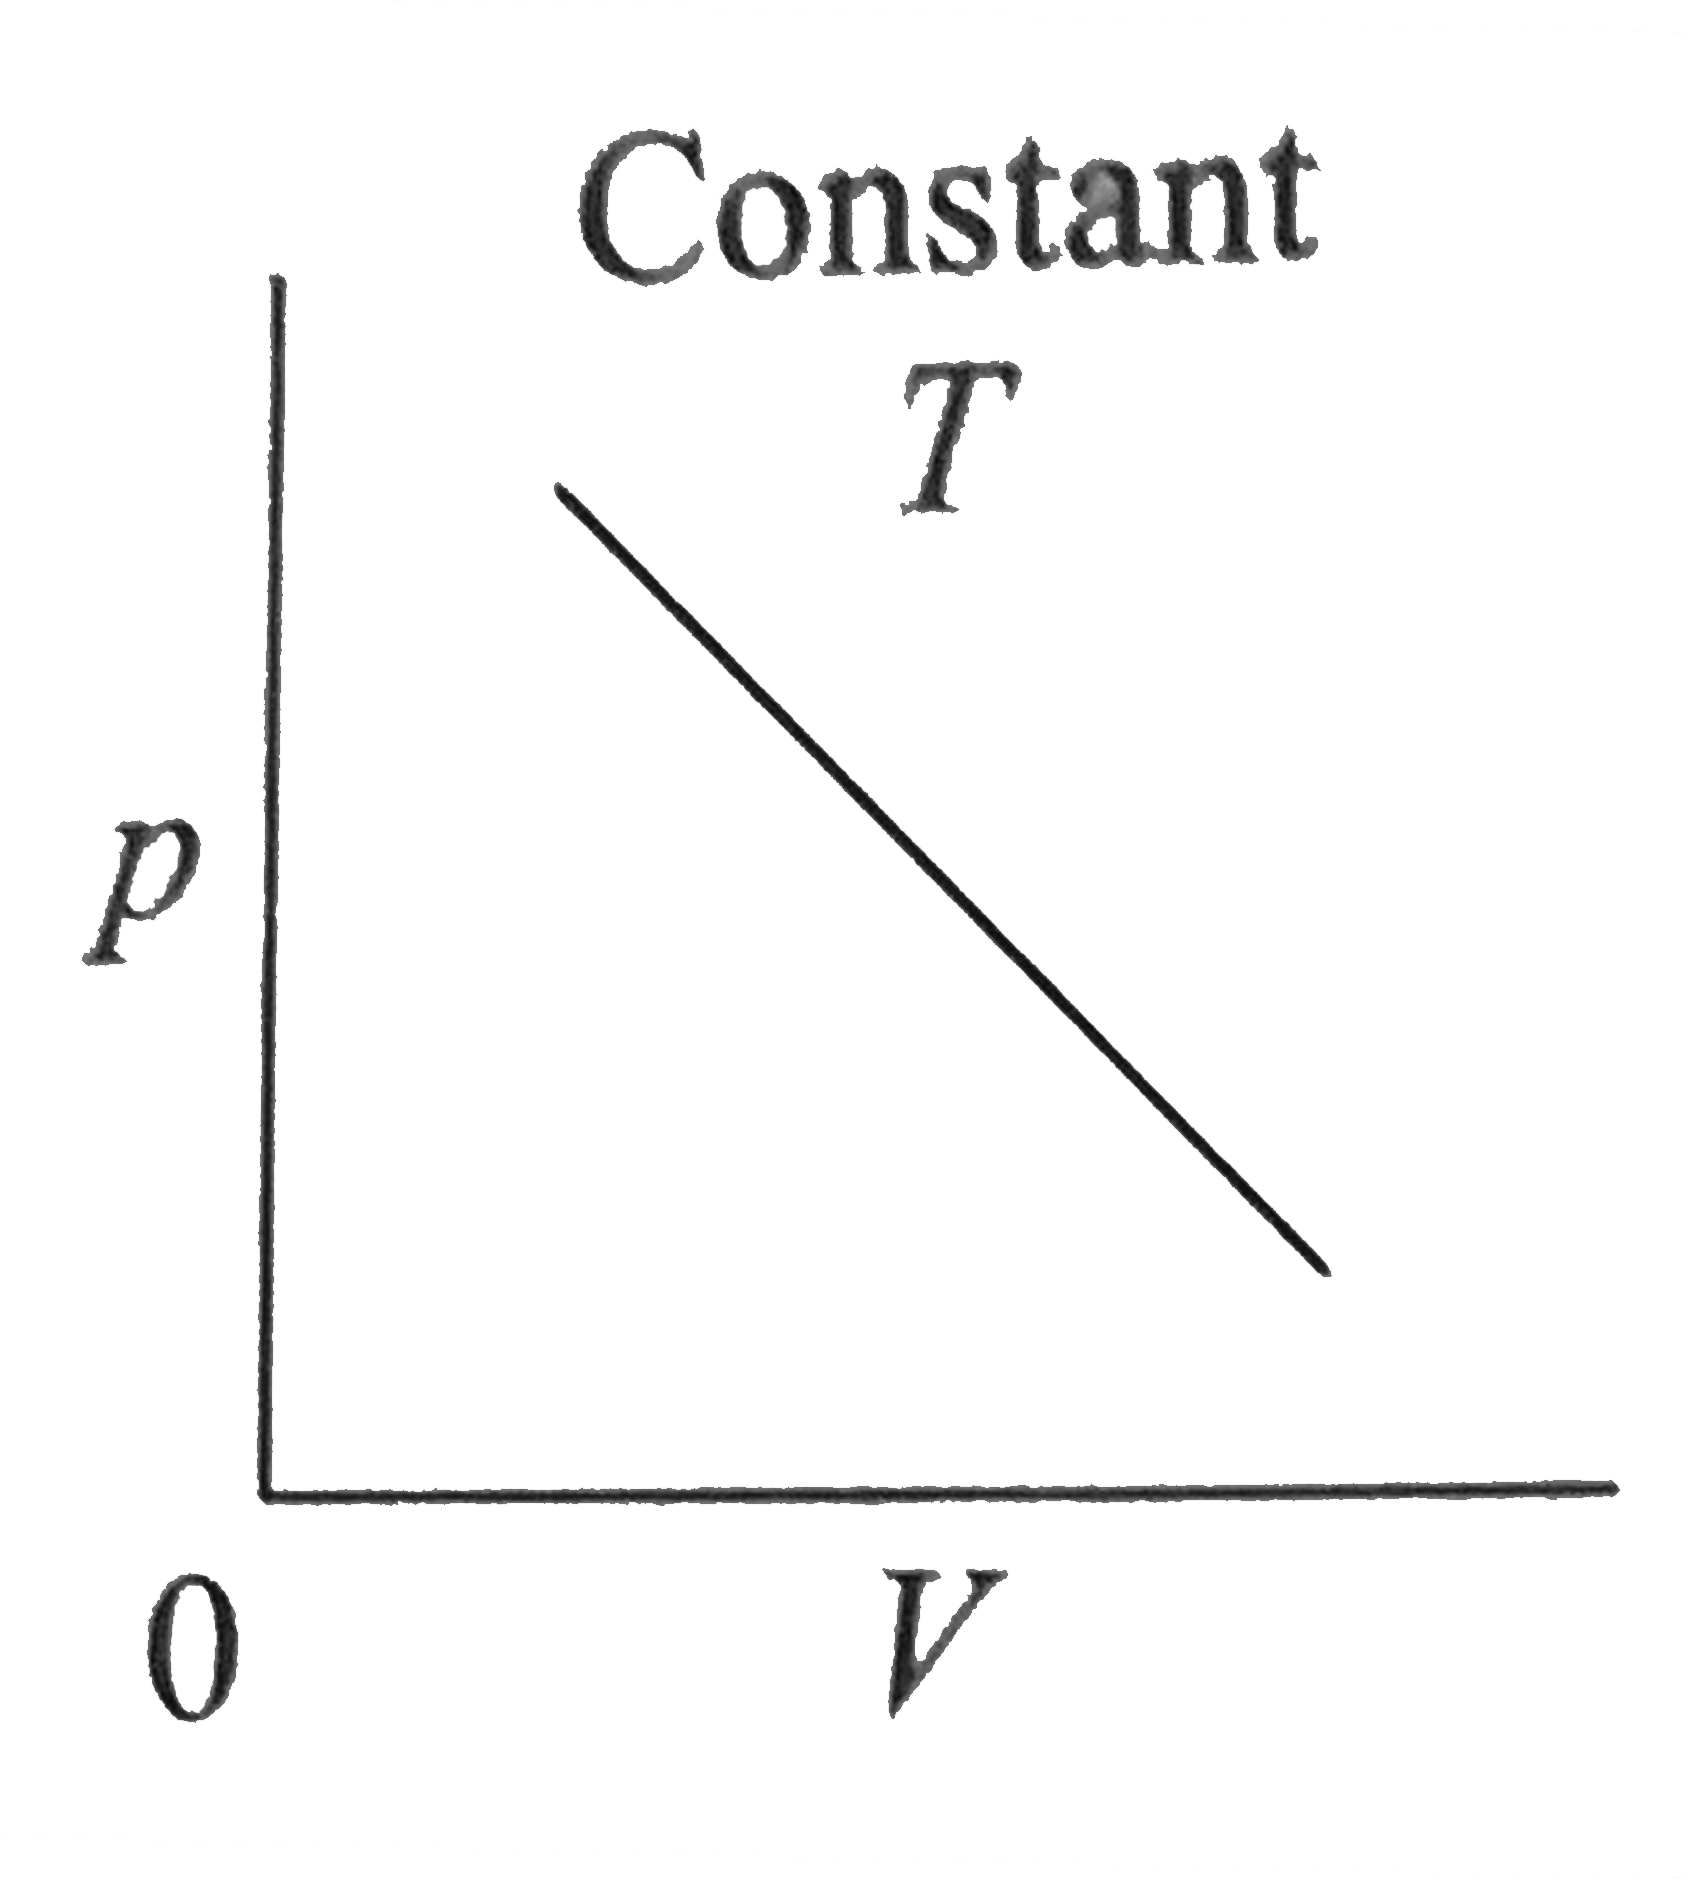 B
B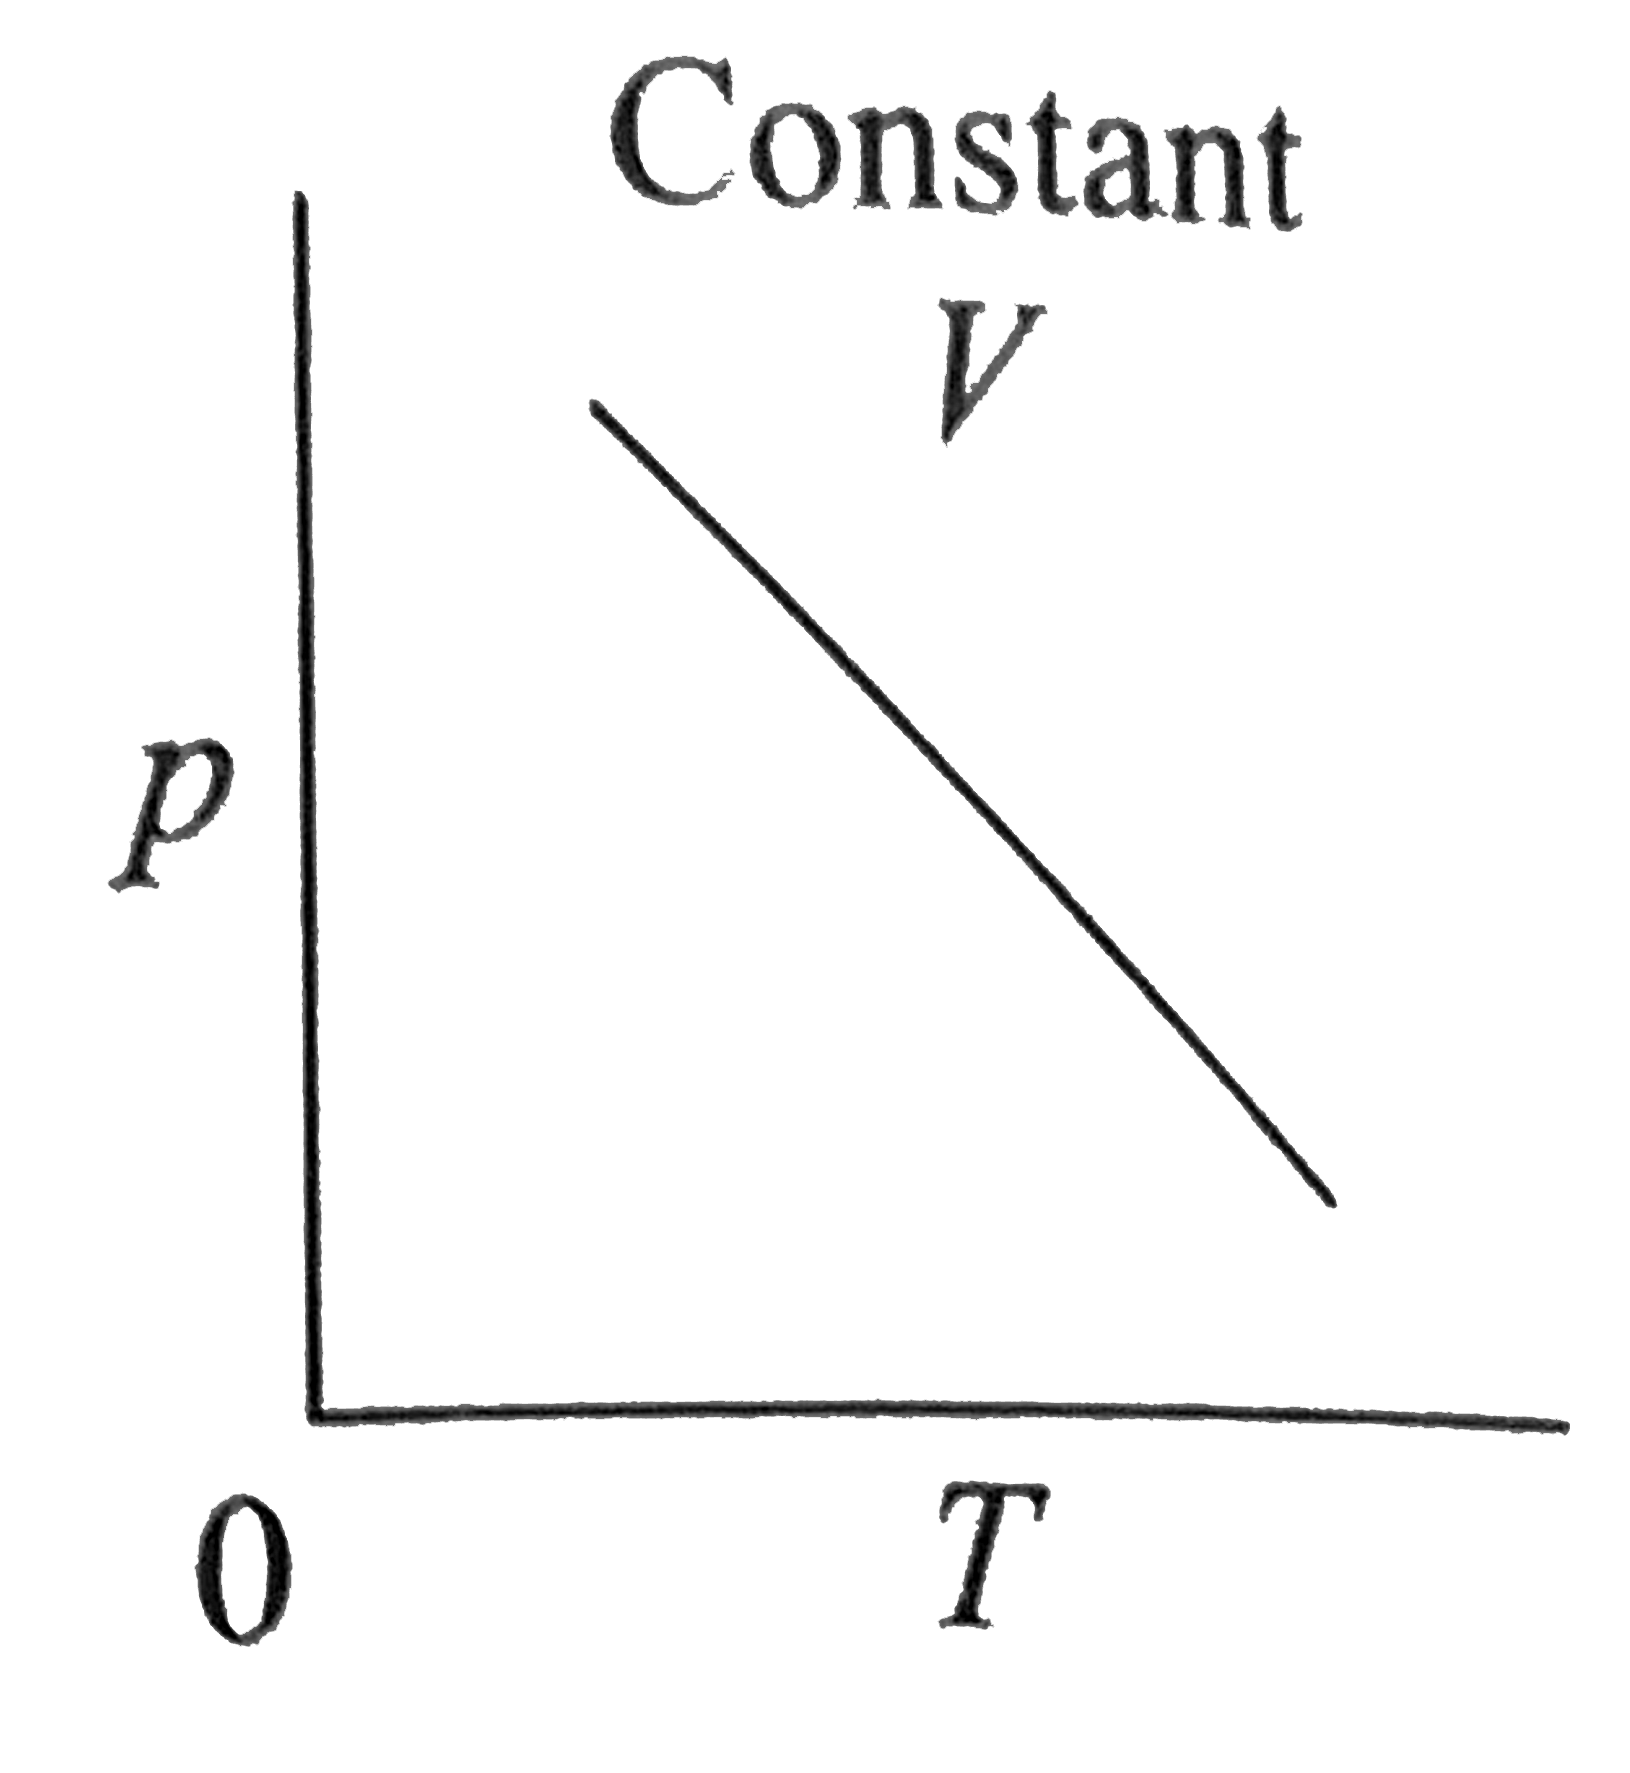 C
C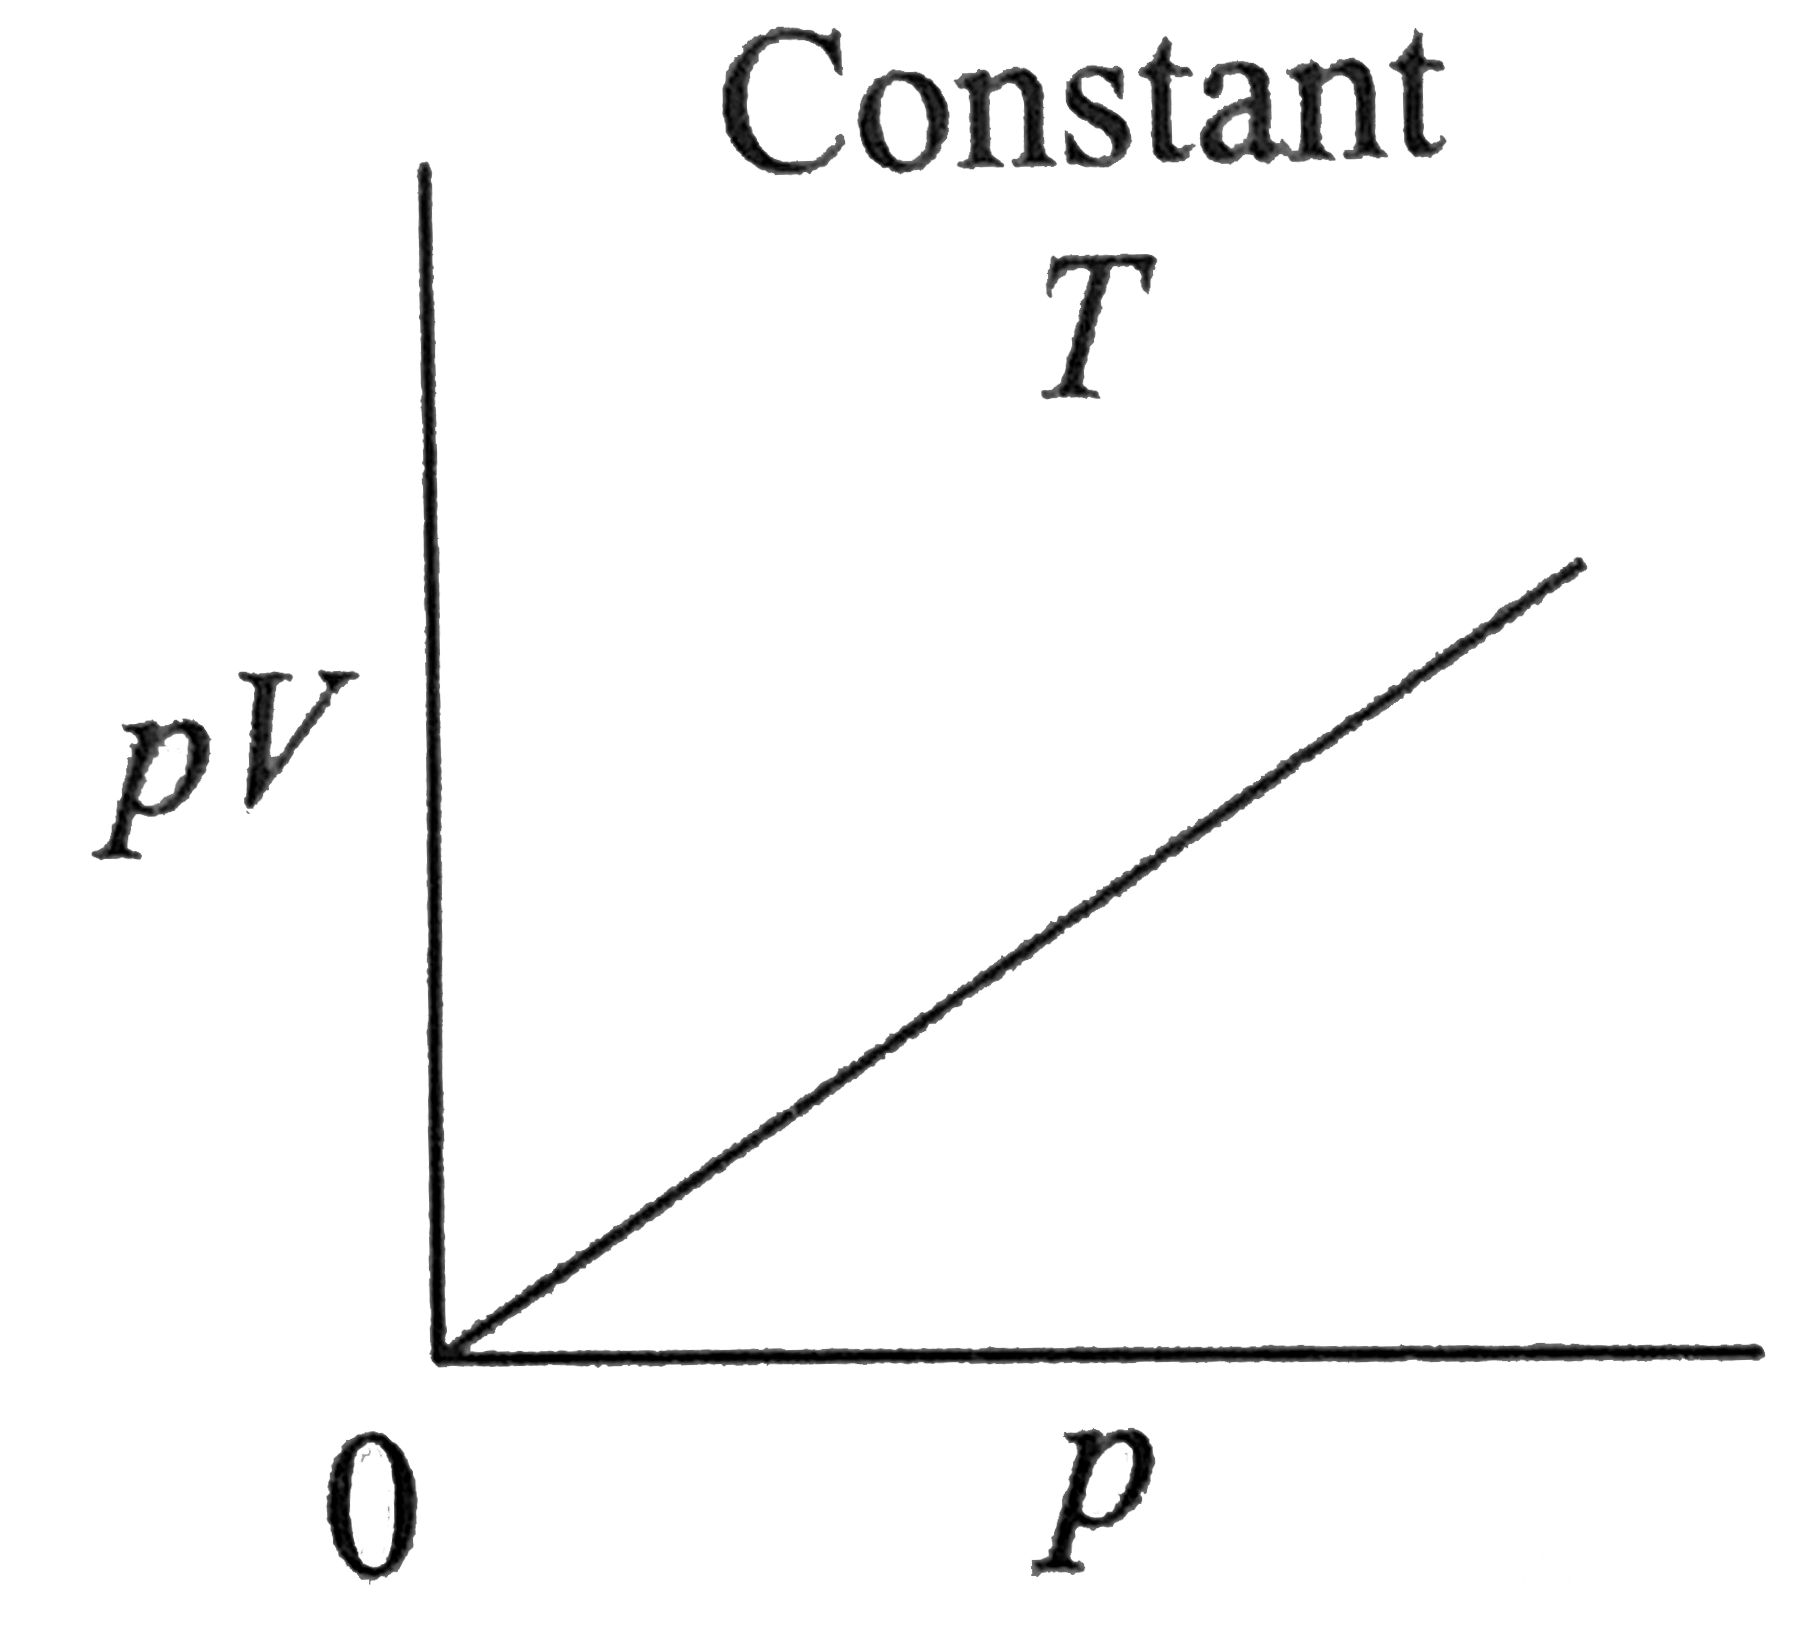 D
D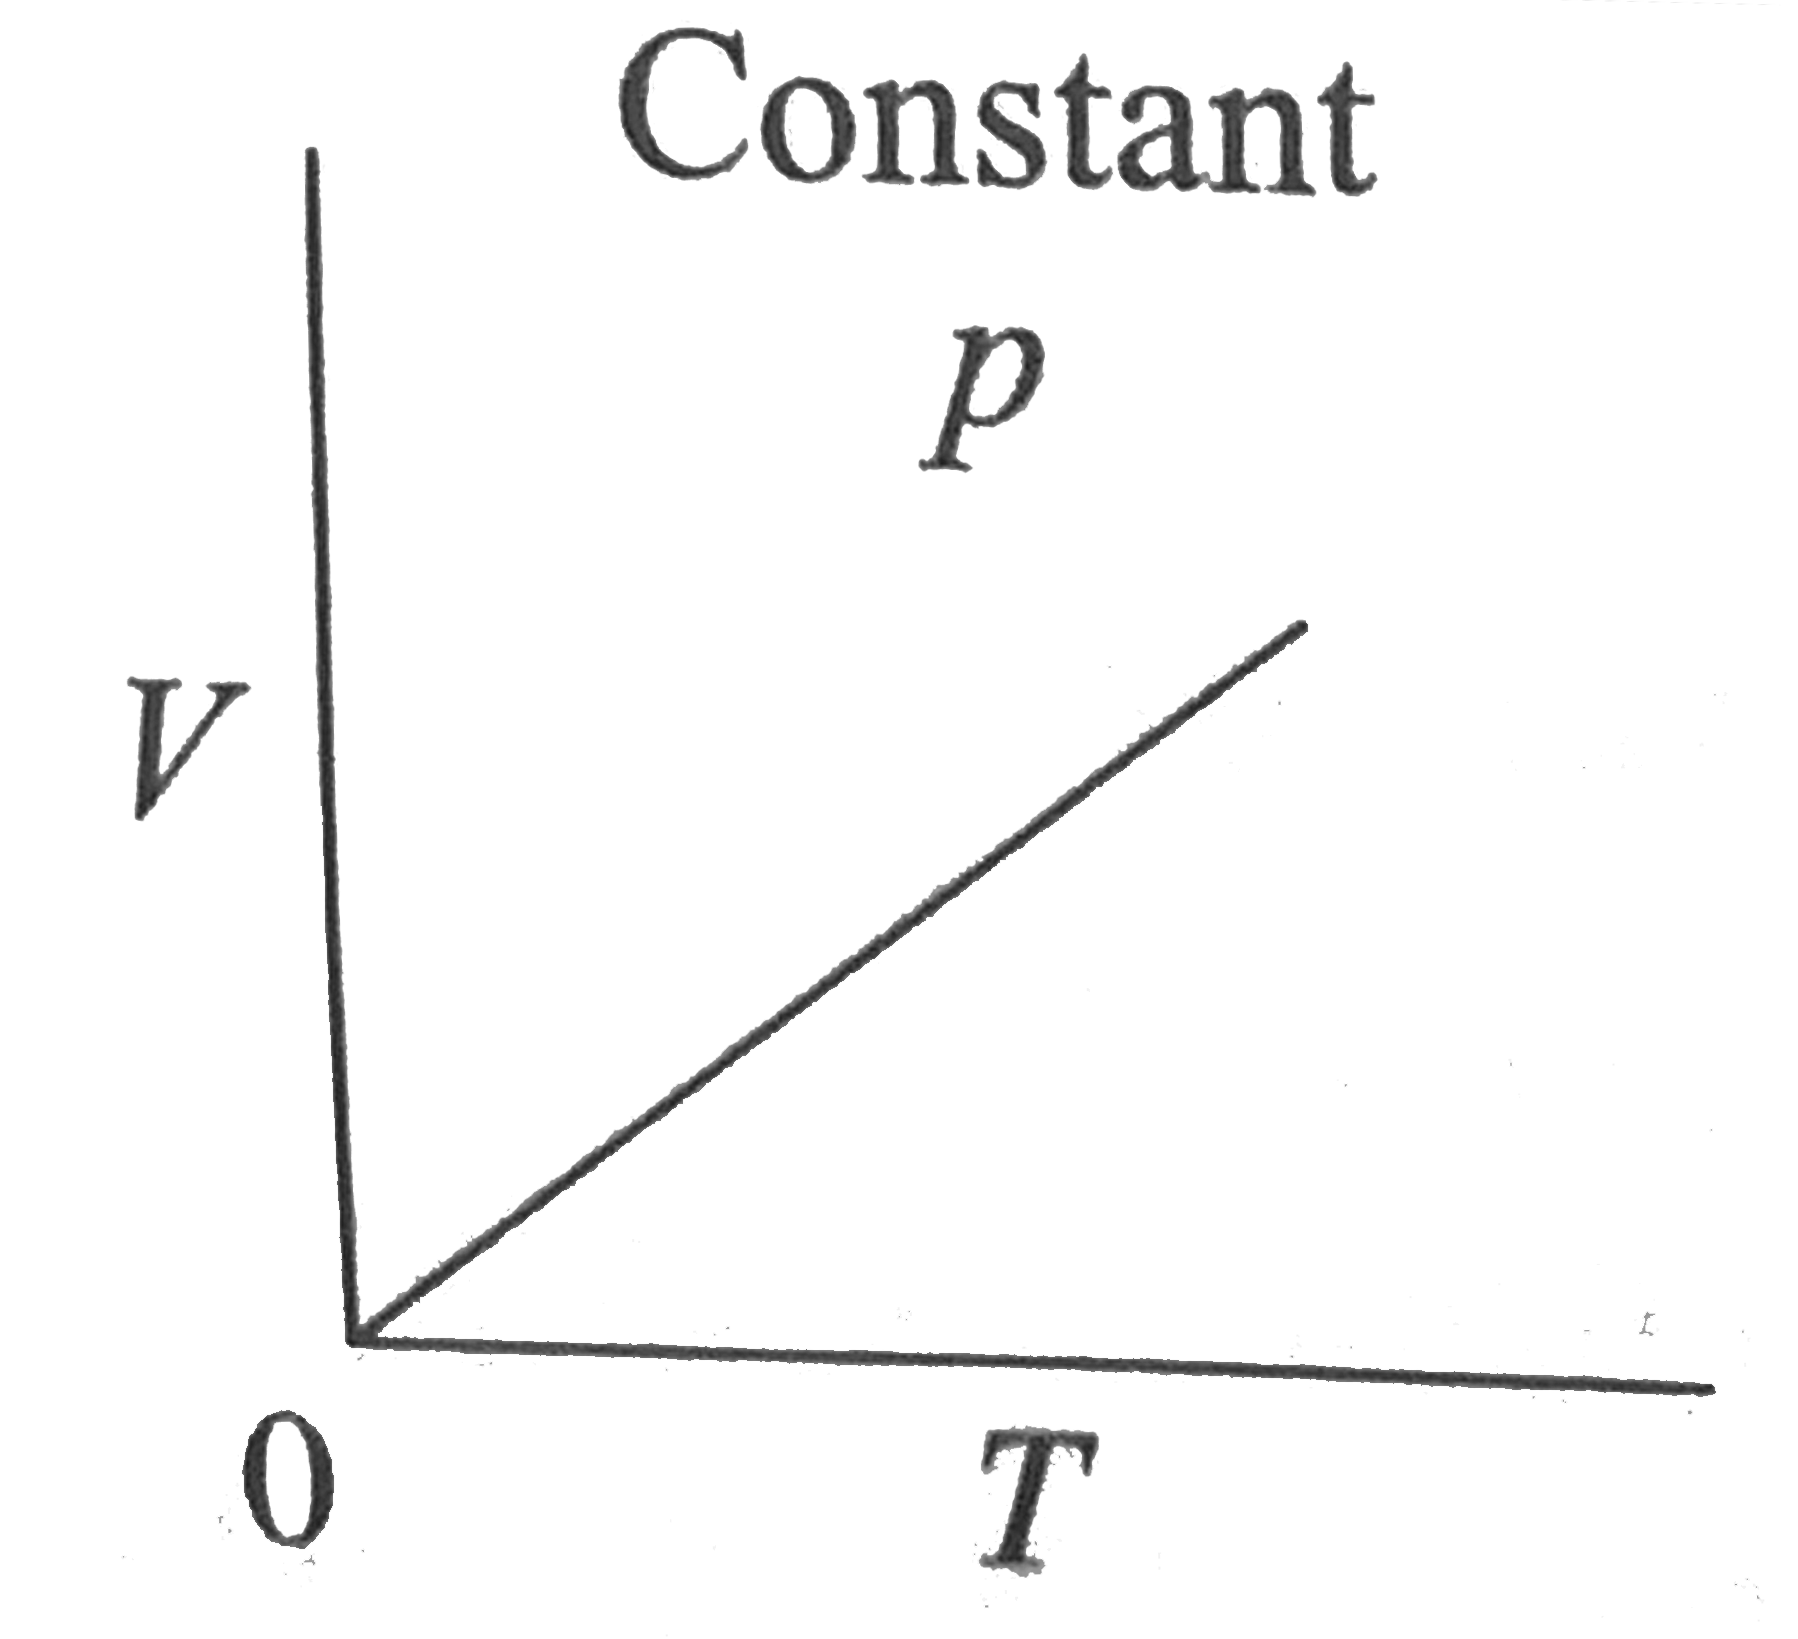
Which one of the following graphs correctly gives the ideal gas behaviour ?
A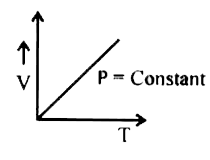 B
B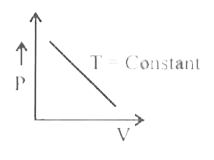 C
C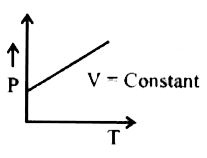 D
D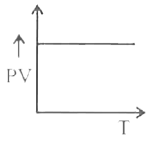
Which of the following graphs is consistent with ideal gas behaviour?
View SolutionWhich of the following diagrams, Fig. depicts ideal gas behaviour ?
View SolutionWhich of the following graphs represent the behaviour of an ideal gas ?
View SolutionWhich of the following graphs represent the behaviour of an ideal gas ?
View SolutionWhich of the following diagrams (figure) depicts ideal gas behaviour?
View Solution

