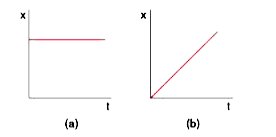
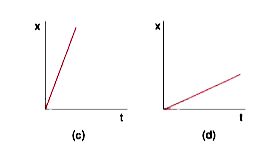
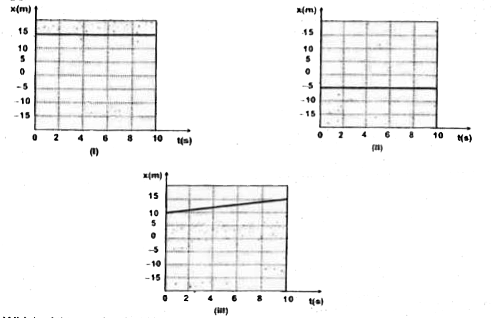
The following graphs represent position – time graphs. Arrange the graphs in ascending order of increasing speed
Text Solution
By the principle of homogeneity, a/V2 is of the dimensions of pressure and b is of the dimensions of volume.
[a] = [pressure] [V2]=[ML−1T−2][L6]=[ML5T−2]
[b] =[V]=L3
|
Topper's Solved these Questions
- APPENDIX 1Book:NCERT TAMILChapter:APPENDIX 1Exercise:SOLVED EXAMPLE UNIT-3
Explore 22 Videos
- APPENDIX 1Book:NCERT TAMILChapter:APPENDIX 1Exercise:SOLVED EXAMPLE UNIT-4
Explore 9 Videos
- APPENDIX 1Book:NCERT TAMILChapter:APPENDIX 1Exercise:SOLVED EXAMPLE UNIT-5
Explore 14 Videos
- GRAVITATIONBook:NCERT TAMILChapter:GRAVITATIONExercise:ADDITIONAL EXERCISES
Explore 4 Videos
Similar Questions
Knowledge Check
Which of the following graphs represents a first order reaction ?
A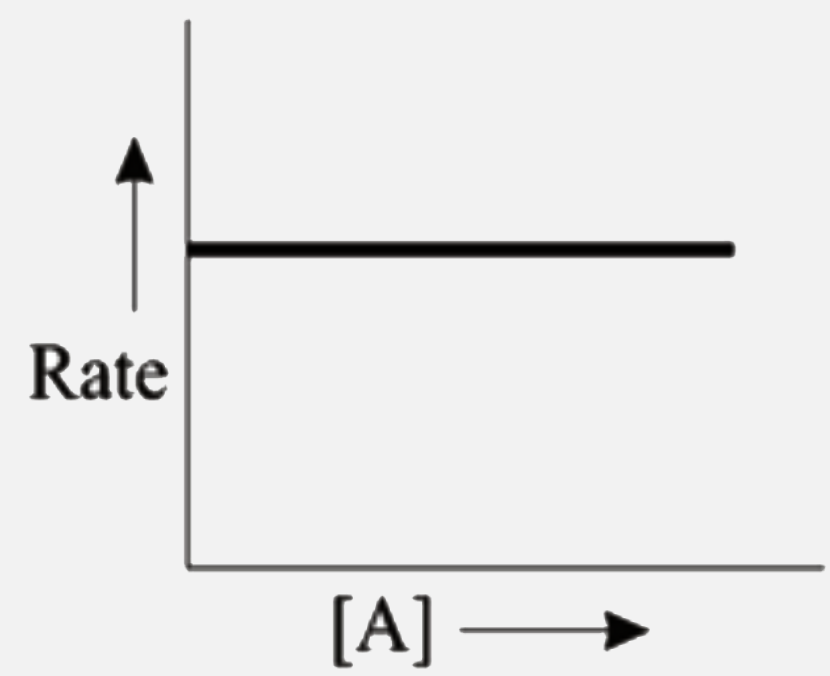 B
B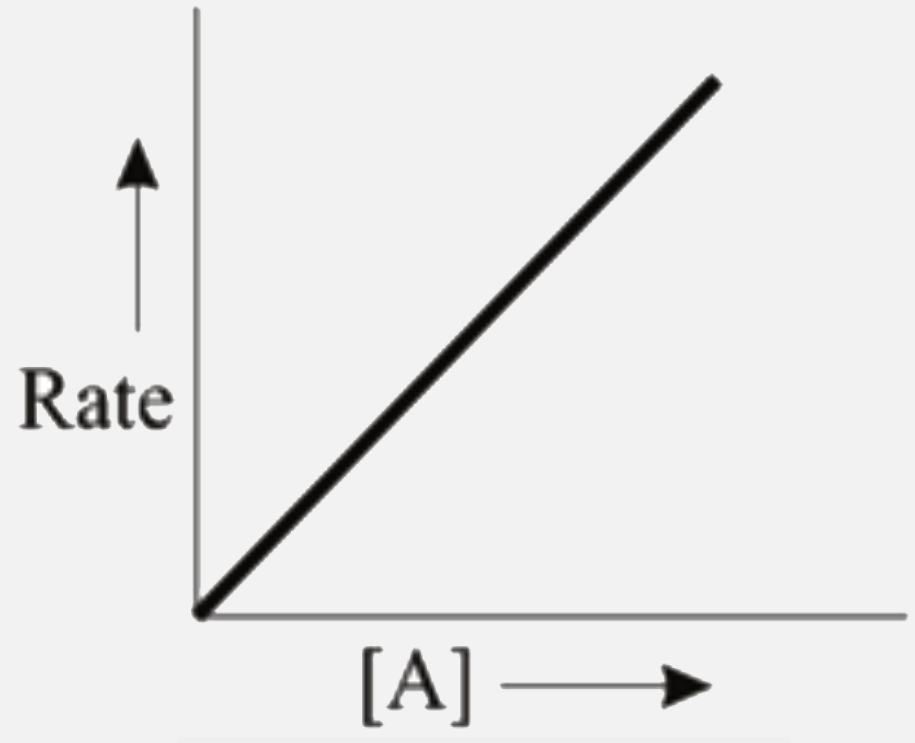 C
C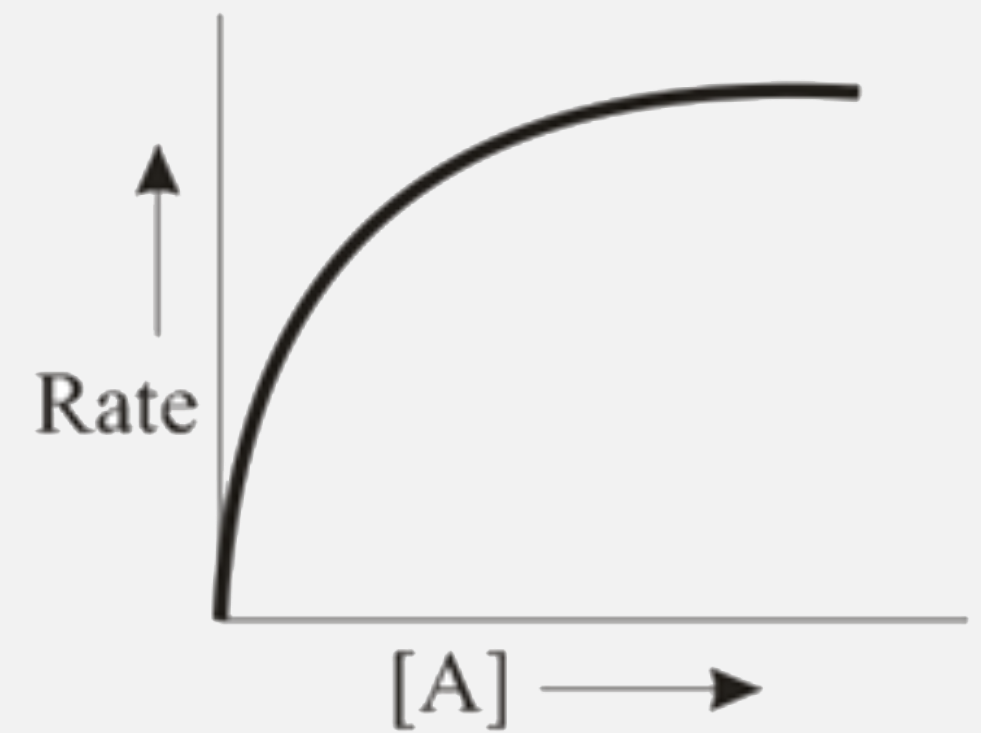 D
D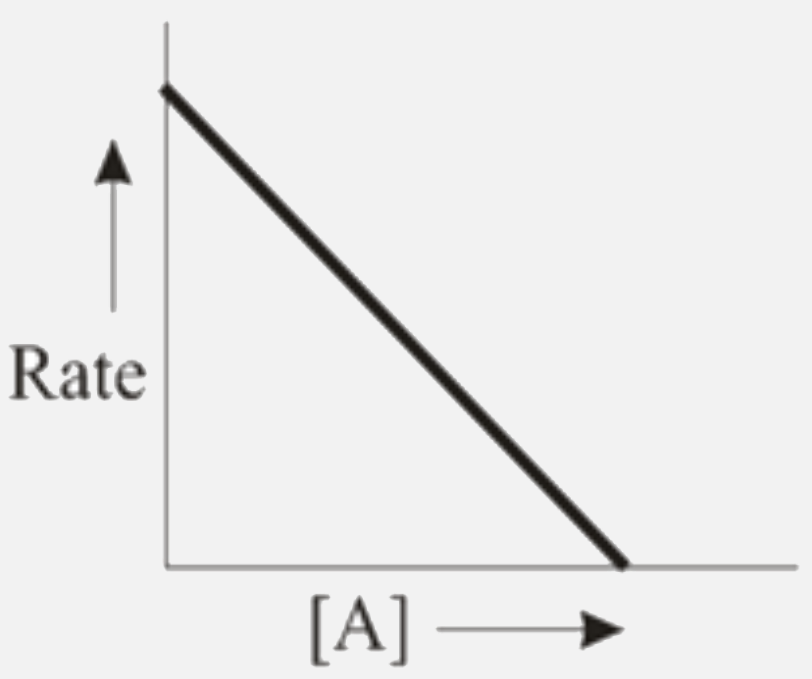
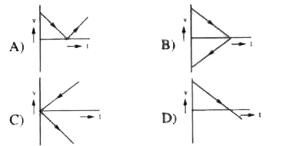
Which graph represents positive acceleration ?
A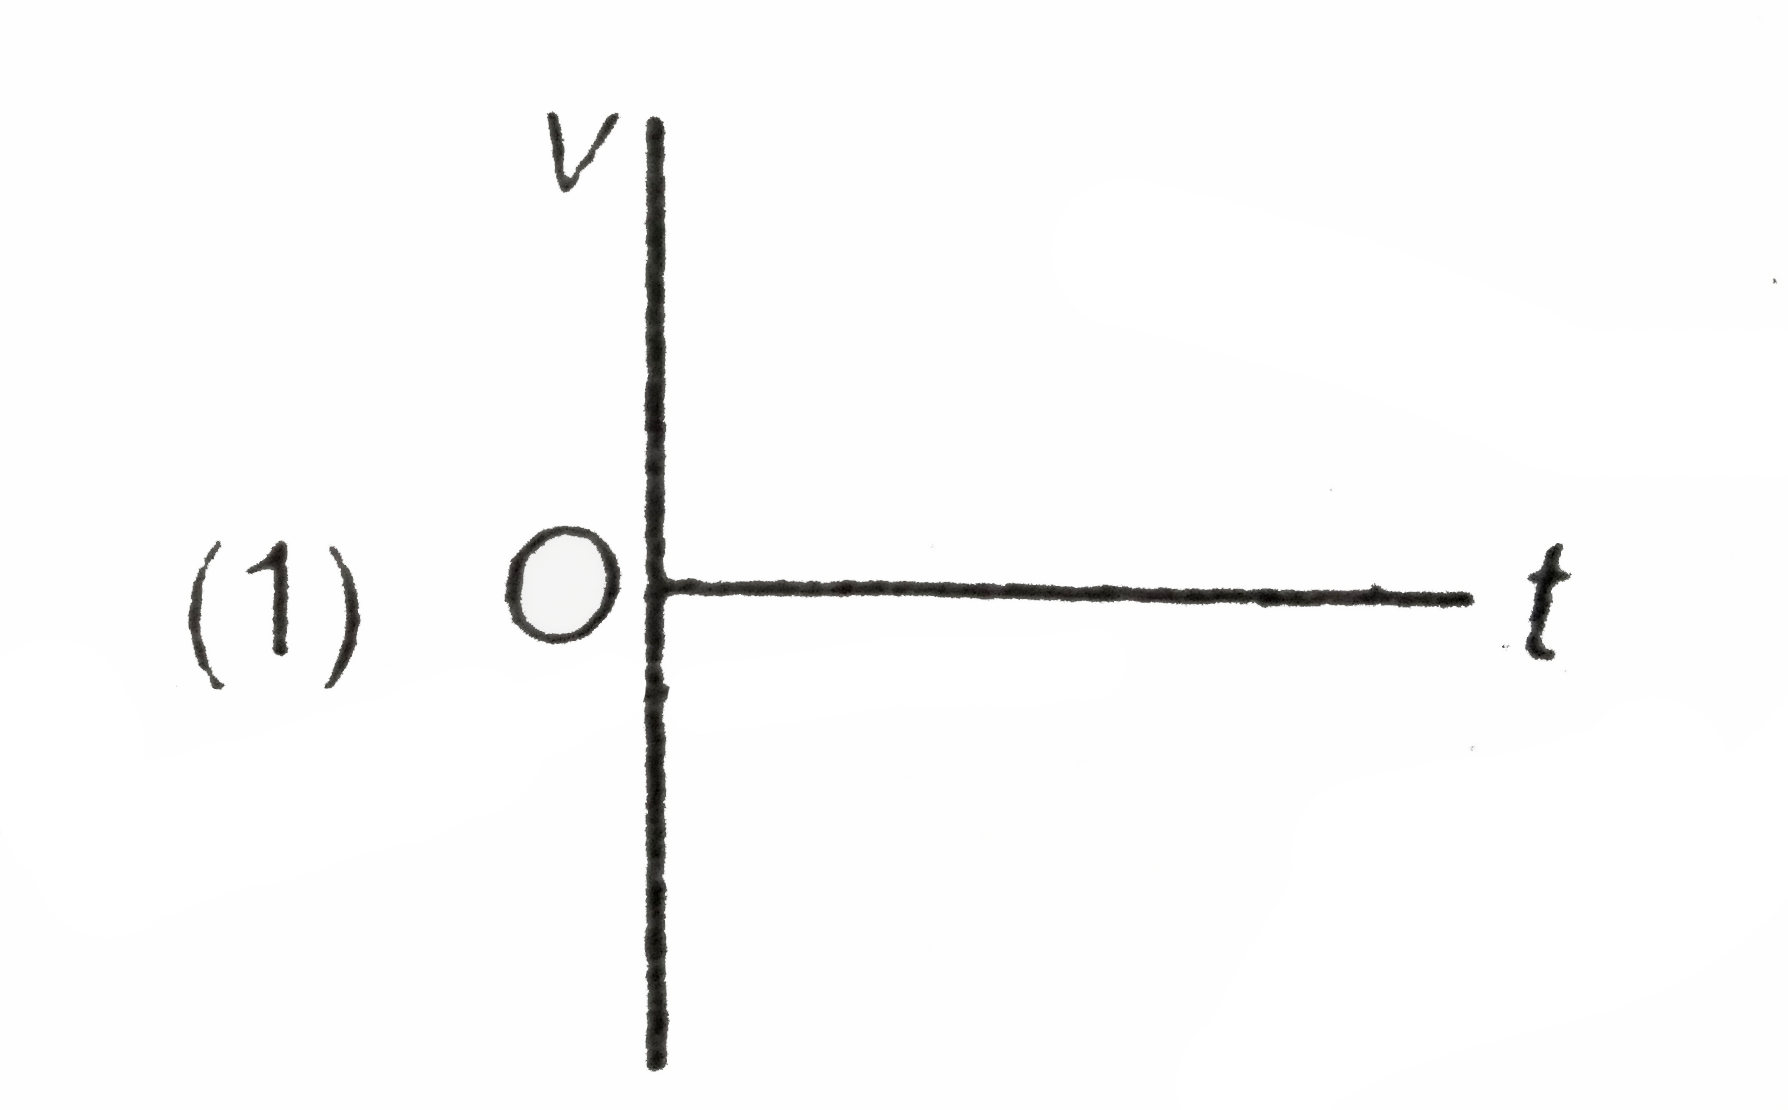 B
B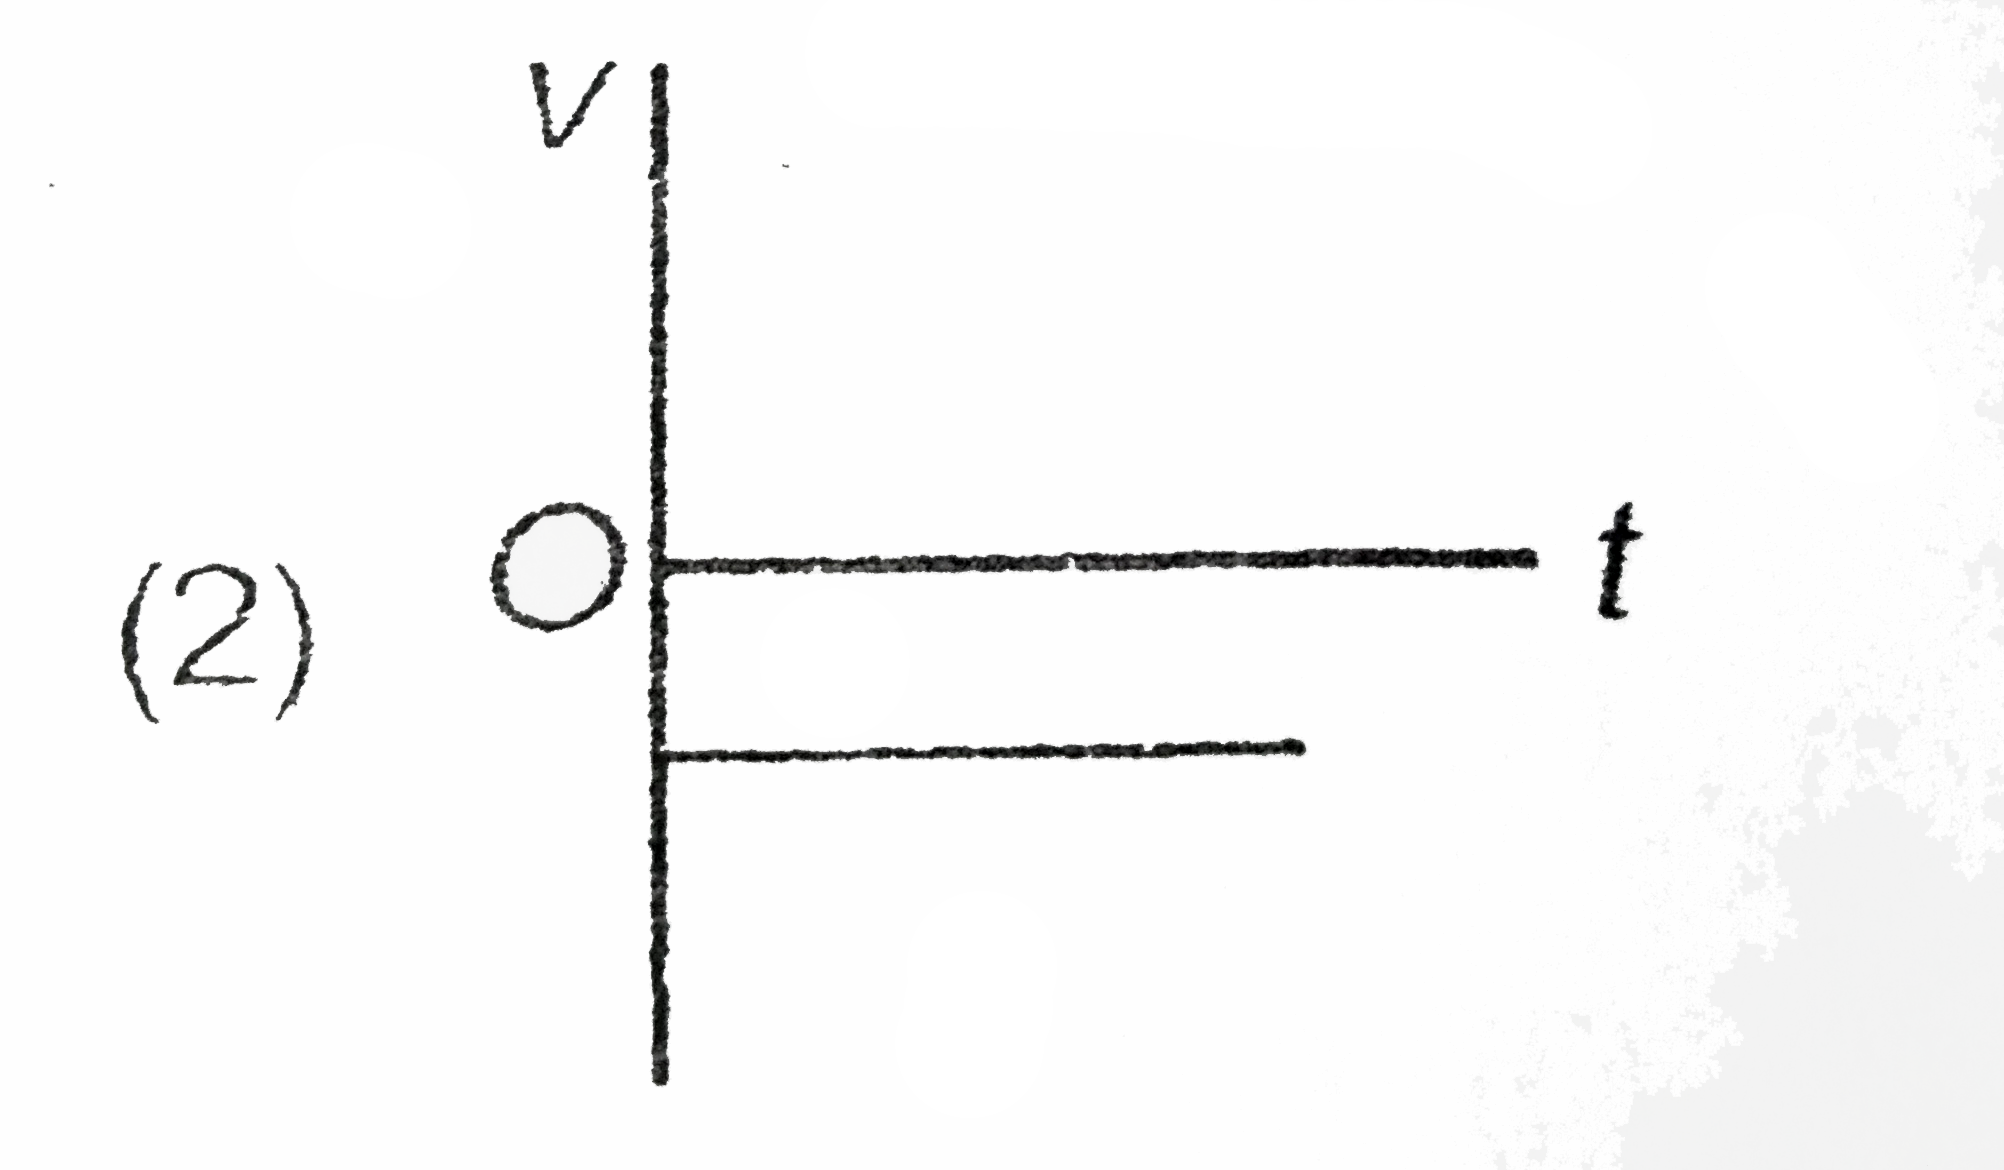 C
C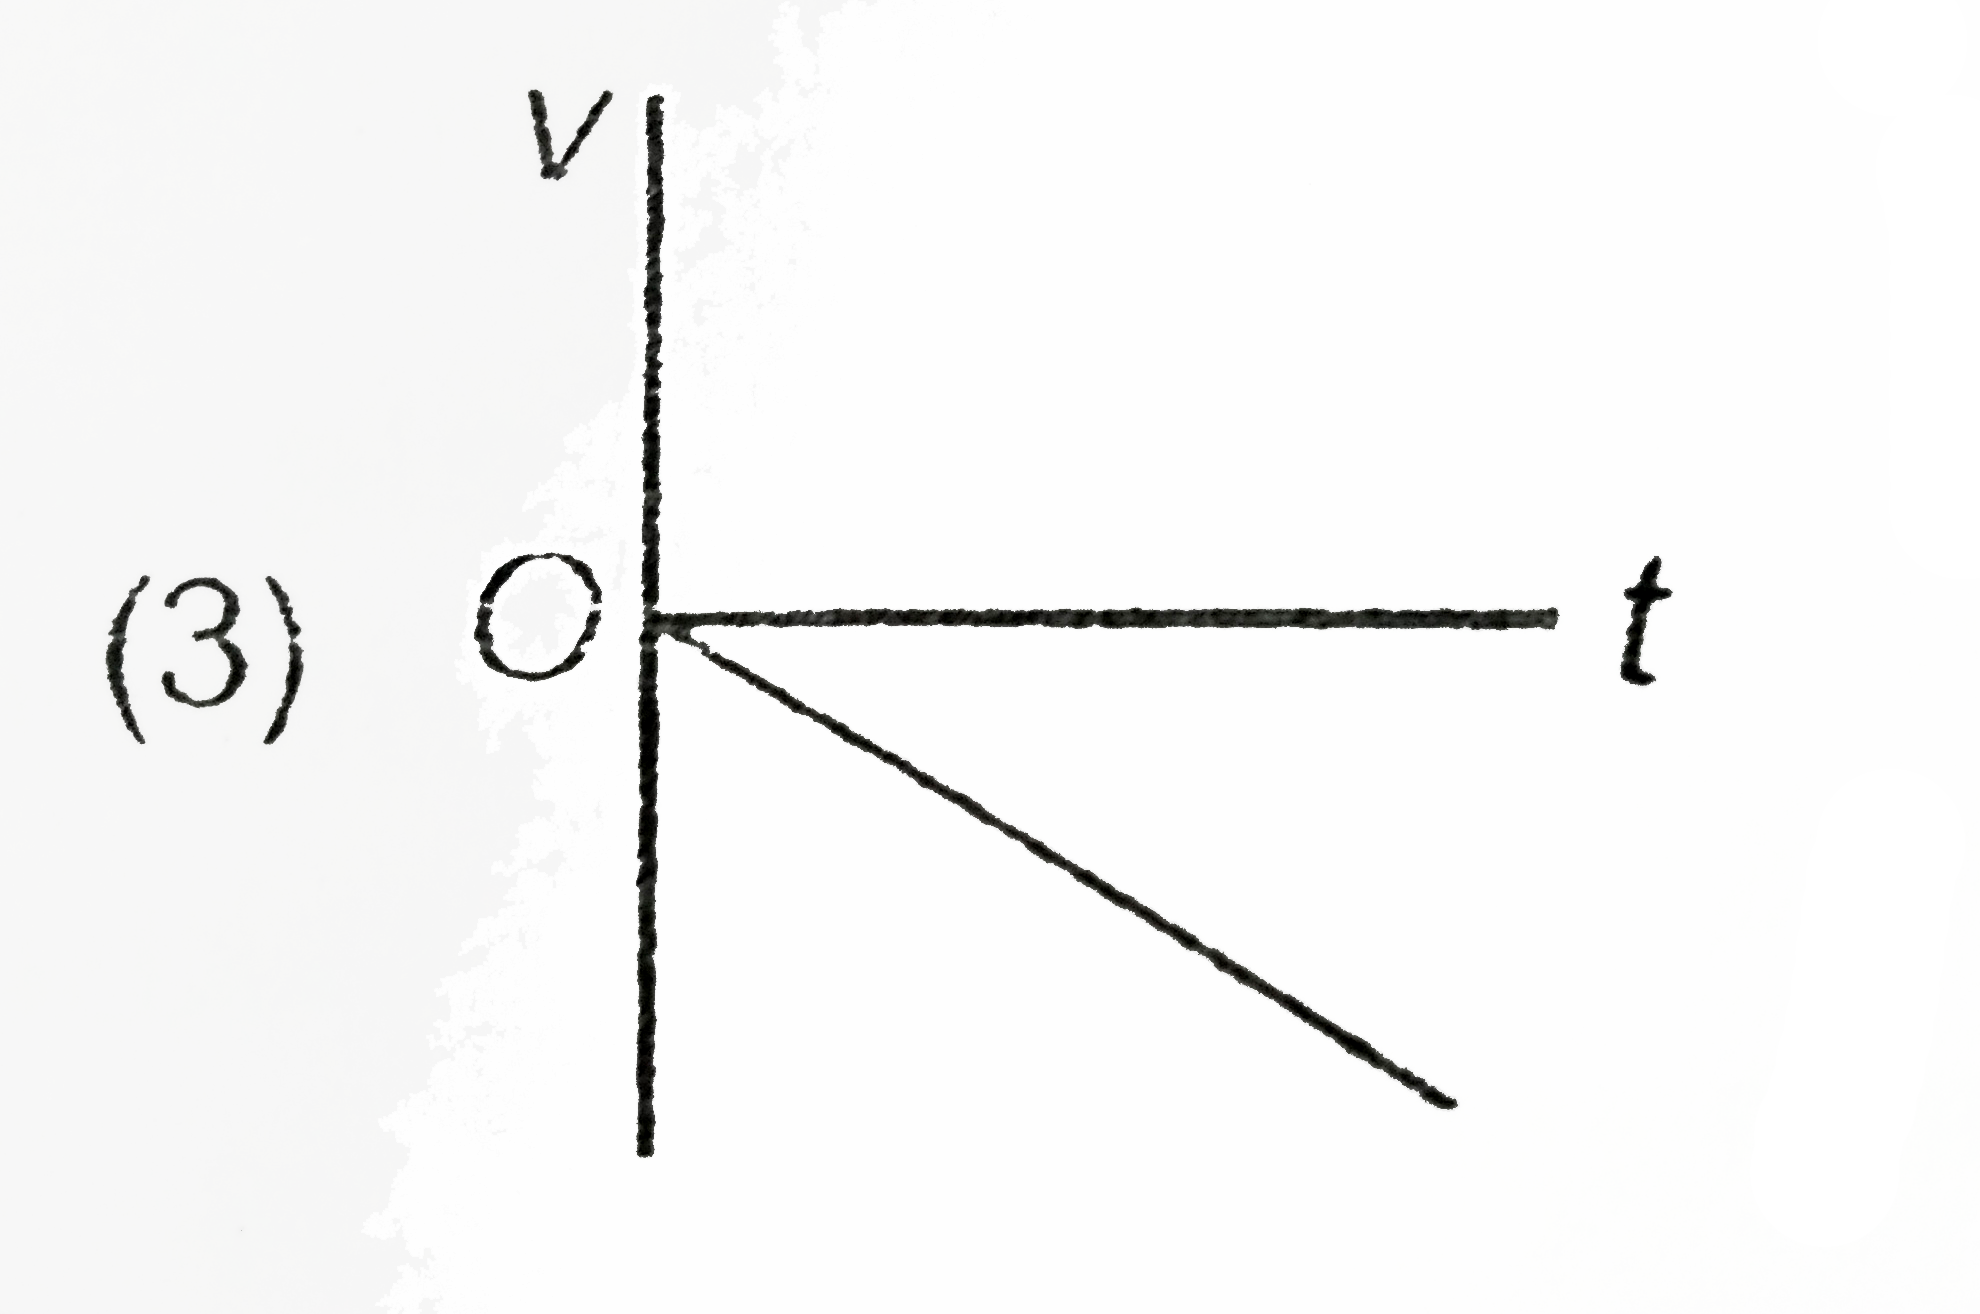 D
D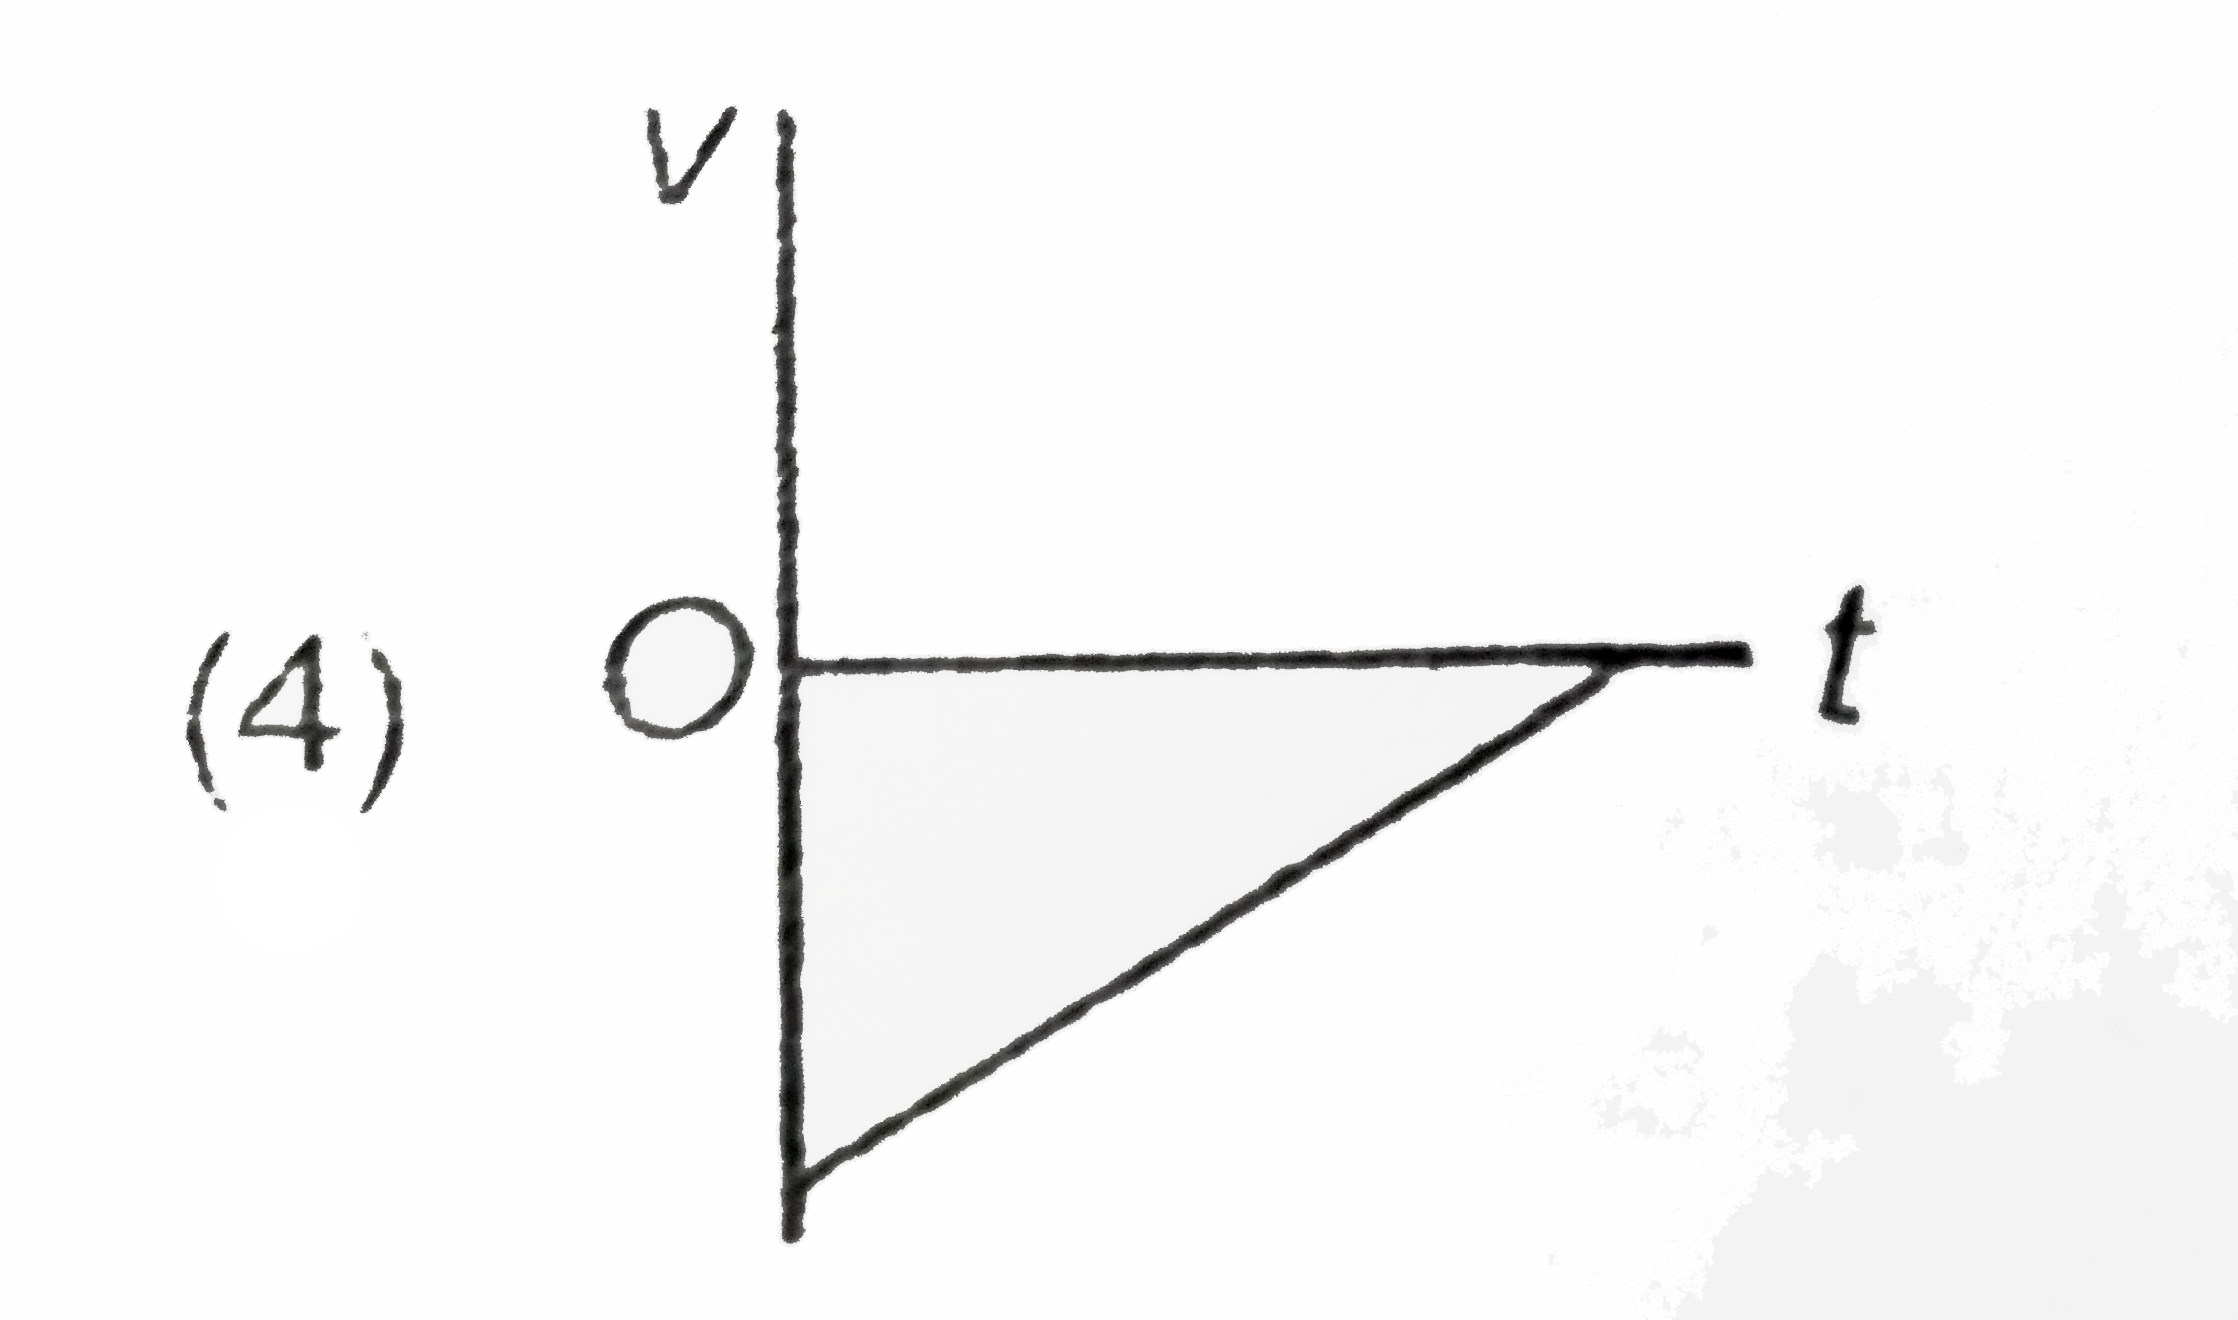
Which of the following graphs represents the position time-graph of a particle moving with negative velocity?
A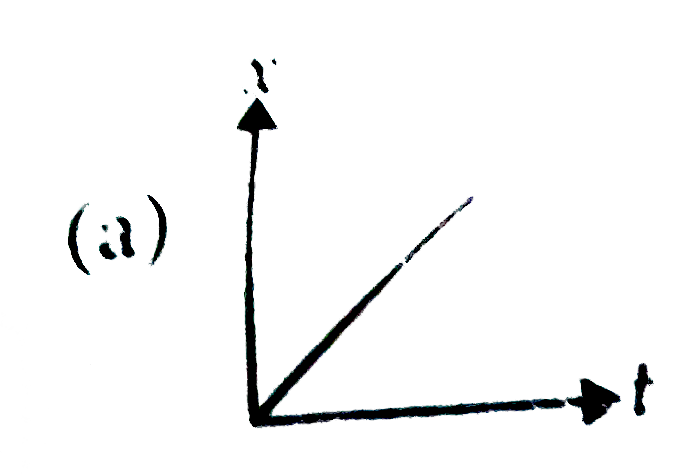 B
B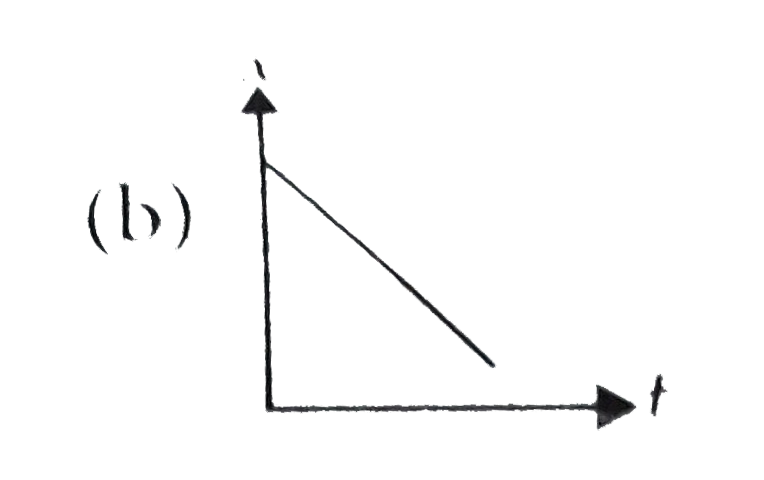 C
C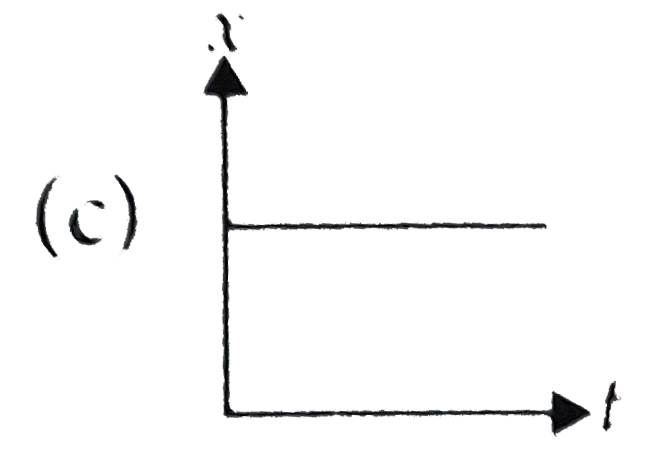 D
D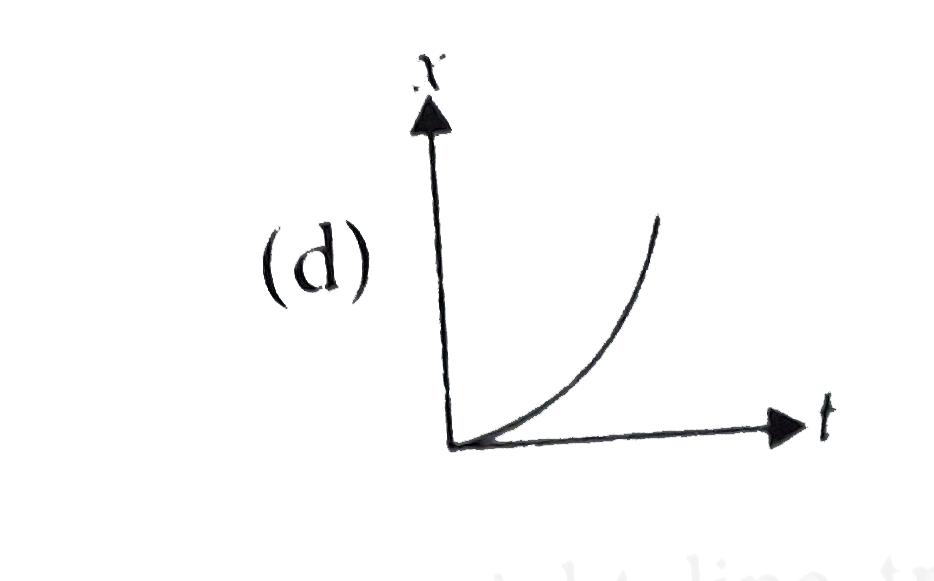
Are the following velocity − time graph and speed − time graphs possible ?

View SolutionAre the following velocity − time graph and speed − time graphs possible ?

View SolutionWhich of the following graphs represents the position time-graph of a particle moving with negative velocity?
View SolutionA ball is thrown vertically upwards. Which of the following graph/graphs represent velocity time graph of the ball during its flight ( air resistance is neglected).
View SolutionFigure shows a graph of potential energy.
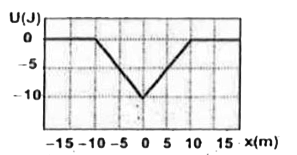
Consider the following graphs of position and time.
Which of the graphs could be the motion of a particle in the given potential?
View Solution

