The Pie-graph given here shows the number of students opting different subjects in a school. If there are a total of 720 students, then by studying the pie-graph answer the questions.
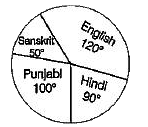
The total number of students studying English and Punjabi subjects are
220
440
110
240
The correct Answer is:B
Step by step video, text & image solution for The Pie-graph given here shows the number of students opting different subjects in a school. If there are a total of 720 students, then by studying the pie-graph answer the questions. The total number of students studying English and Punjabi subjects are by Maths experts to help you in doubts & scoring excellent marks in Class 14 exams.
Updated on:21/07/2023Topper's Solved these Questions
- SOLVED PAPER 2015BOOK - ARIHANT PUBLICATION PUNJABCHAPTER - SOLVED PAPER 2015EXERCISE - SECTION - C - MATHEMATICS
30 Videos
- PROBLEMS BASED ON ARITHMETIC BOOK - ARIHANT PUBLICATION PUNJABCHAPTER - PROBLEMS BASED ON ARITHMETIC EXERCISE - CHAPTER EXERCISE
72 Videos
- SOLVED PAPER 2016BOOK - ARIHANT PUBLICATION PUNJABCHAPTER - SOLVED PAPER 2016EXERCISE - Section D (Mathematics)
30 Videos
Similar Questions
The given bar graph, shows the number of students in different classes.
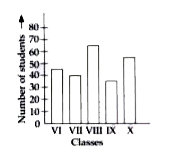
Find the total number of students in the classes VIII to X.
View SolutionThe pie-chart given below shows the number of students enrolled in a school in different activities. Total number of students in the school is 1200. Study the chart and answer the questions.
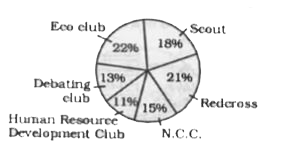
What is the total number of students enrolled in Debating Club and HRD Club ?
View Solution
Knowledge Check
The Pie-graph given here shows the number of students opting different subjects in a school. If there are a total of 720 students, then by studying the pie-graph answer the questions.
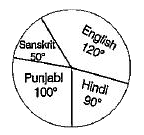
The difference in the number of students studying Hindi and Sanskrit subjects isA40B80C120D140The number of students enrolled in different faculties in a school is as follows

The percentage of students studying in Science and Vocational Subject is:A1. 37.2B2. 23C3. 25D4. 9.3The pie-chart given below represents the number of students using different transport to a school in which total number of students is 2160.
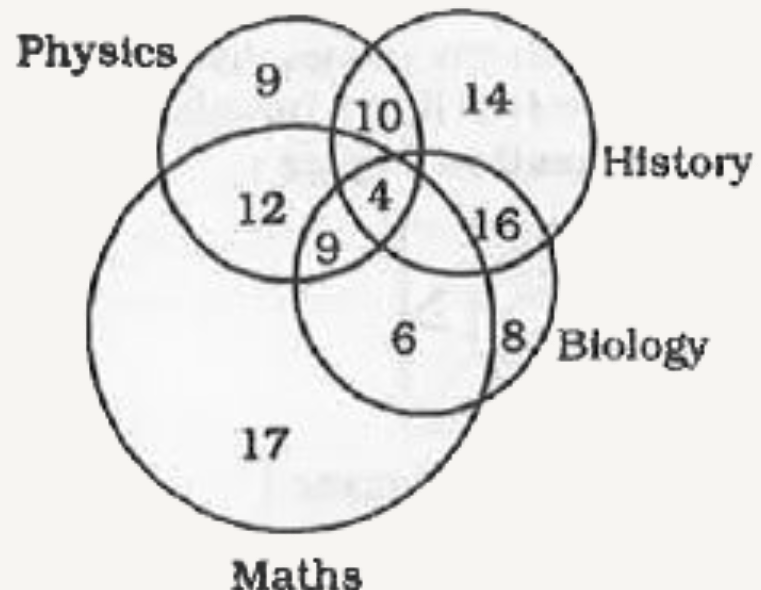
Answer the questions based on the following diagram.
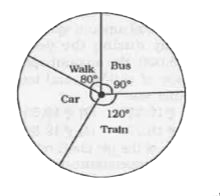
The total number of students coming to school either by walking or by bus isA480B540C1020D170
The diagram represents the number of students studying different subjects. What is the number of students who study History and Biology?
View SolutionThe pie-chart given below shows the number of students enrolled in a school in different activities. Total number of students in the school is 1200. Study the chart and answer the questions.
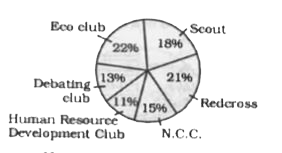
The number of students enrolled in Eco-club is what per cent of those enrolled in Redcross activities ?
View SolutionThe pie-chart given below shows the number of students enrolled in a school in different activities. Total number of students in the school is 1200. Study the chart and answer the questions.
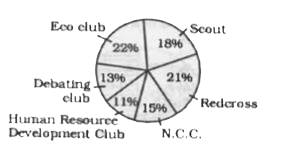
What is the ratio of number of students enrolled in Scout and Redcross activities together to those enrolled in Debating Club activities ?
View SolutionThe pie chart given below shows the number of students in 6 different sections. The total number of students is 1800.
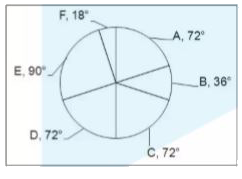
What is the difference between the number of students in section F to the number of students in section C?
View SolutionThe pie chart given below shows the number of students in 6 different sections. The total number of students is 1800.
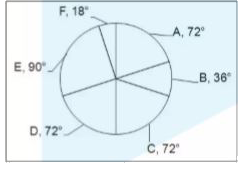
What is the ratio of number of students in section D to the number of students in section F and B?
View Solution
