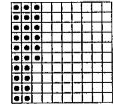
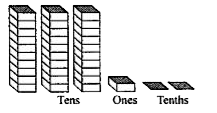
Complete the table with the help of these boxes and use decimals to write the number.
 Solution in Punjabi
The correct Answer is:0.26
Step by step video, text & image solution for Complete the table with the help of these boxes and use decimals to write the number. by Maths experts to help you in doubts & scoring excellent marks in Class 6 exams.
Updated on:21/07/2023Topper's Solved these Questions
- DECIMALSBOOK - NAND LAL PUBLICATIONCHAPTER - DECIMALSEXERCISE - EXERCISE 8.3
15 Videos
- DECIMALSBOOK - NAND LAL PUBLICATIONCHAPTER - DECIMALSEXERCISE - EXERCISE 8.4
24 Videos
- DECIMALSBOOK - NAND LAL PUBLICATIONCHAPTER - DECIMALSEXERCISE - EXERCISE 8.1
48 Videos
- BASIC GEOMETRICAL IDEAS BOOK - NAND LAL PUBLICATIONCHAPTER - BASIC GEOMETRICAL IDEAS EXERCISE - SAMPLE PAPER FOR PRACTICE
18 Videos
- FRACTIONSBOOK - NAND LAL PUBLICATIONCHAPTER - FRACTIONSEXERCISE - DO THIS (PAGE - 155)
5 Videos
Similar Questions
Which is greater?Give reason for your answer.
0.3 or 0.4
View SolutionExpress as Rupees using decimals:
5 paisa
View SolutionWrite the following as numbers in the given table.

View SolutionIf lines l and m intersect at a point Also m and n intersect at a point, is it necessary that lines l,m,n intersect at the same point.
View SolutionI read 25 of the book inn one day and 15 of the book next day. What portion of book did I read in two days?
View SolutionHow many lines of symmetry does the above figure have ?
View SolutionWhich of the following are correct chain isomers of butane ? (i)
View SolutionDetermine the point of symmetry of a regular hexagon.
View SolutionDtermine the images of the following figure about the given line :
View SolutionMatch the following Column A to Column B

View SolutionMatch the following Column A to Column B

View SolutionMatch the following Column A to Column B

View SolutionFind the area of the figure given below.

View SolutionThe area of the shaded part in the figure given below is ______.

View SolutionThe inequation represented by the graph given below is :
View SolutionThe inequation that best describes the graph given below is _________
View Solution
