Import : Export :: Expenditure : ?
Debt
Tax
Deficit
Revenue
The correct Answer is:D
.Import is antonym of .Export..
Similarly, .Expenditure. is antonym of .Revenue..
Topper's Solved these Questions
- BOOK - LUCENT PUBLICATIONCHAPTER - ANALOGY : WORD EXERCISE - EXERCISE-2 (TYPE-II : ANALOGOUS PAIR SELECTION)19videos
ANALOGY : WORD
- BOOK - LUCENT PUBLICATIONCHAPTER - ANALOGY : WORD EXERCISE - EXERCISE-2 (TYPE-III : DIRECT ANALOGY)17videos
ANALOGY : WORD
- BOOK - LUCENT PUBLICATIONCHAPTER - ANALOGY : WORD EXERCISE - EXERCISE-1 (TYPE-V :PAIR GROUP SELECTION)2videos
ANALOGY : WORD
- BOOK - LUCENT PUBLICATIONCHAPTER - ANALOGY : NUMBEREXERCISE - Exercise19videos
ANALOGY : NUMBER
- BOOK - LUCENT PUBLICATIONCHAPTER - BEST REASON AND COMMON SENSE EXERCISE - EXERCISE79videos
BEST REASON AND COMMON SENSE
Similar Questions
Why are exports included in the estimation of domestic product by the expenditure method ? Can gross domestic product be greater than gross national product ? Explain.
View SolutionStudy the following graph carefully to answer the questions given below it Import and Export of spare parts by an automobile company over the given years
During which year the percentage rise/fall in exports from the previous year is the highest?View Solution
Knowledge Check
- Question 1 - Select One
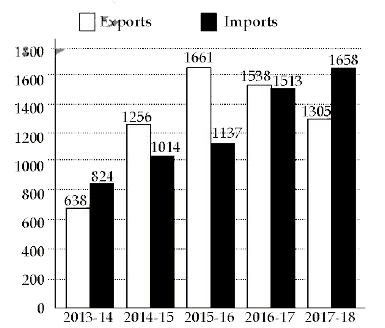
The given Bar graph presents the Imports and Exports of an item manufactured by a company for the five financial years, 2013-2014 to 2017-2018.

In which financial year the absolute difference of the Exports to those of Imports is the lowest?A2016-2017B2015-2016C2014-2015D2013-2014 - Question 2 - Select One
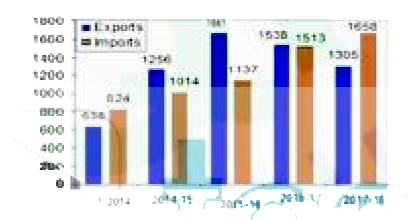
Study the following graph carefully to answer the questions given below it Import and Export of spare parts by an automobile company over the given years
What is the ratio of total imports to total exports for all the given years together?A61:57B61:69C69:62D67:63 - Question 3 - Select One
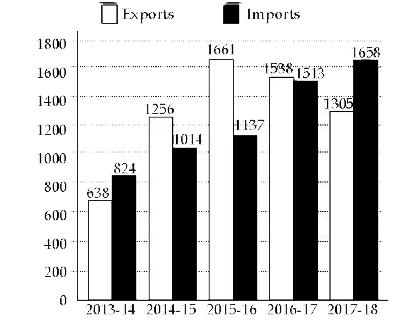
The given Bar Graph presents the Imports and Exports of an item (in tonnes) manufactured by a company for the five financial years, 2013-2014 to 2017- 2018

In which financial year, the absolute difference of the Exports to those of Imports is the lowest?A2016-2017B2015-2016C2014-2015D2013-2014
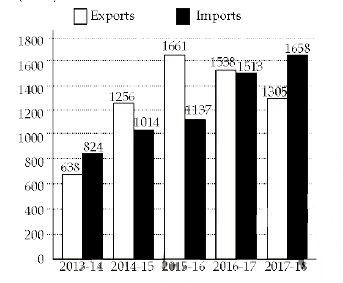
The given bar graph presents the Imports and Exports of an item manufactured by a company for the five financial years, 2013-2014 to 2017-2018.

In which financial year the percentage increase in total of Exports and Imports is the highest in comparison to its previous financial year?View SolutionThe given bar graph presents the Imports and Exports of an item manufactured by a company for the five financial years, 2013-2014 to 2017-2018.

What is the average of total import and Export during the five financial year?View SolutionThe given bar graph presents the imports and Exports of an item manufactured by a company for the give financial years, 2013-2014 to 2017 -2018.

What is the of total imports to total exports during the five financial years?View SolutionThe given bar graph presents the Imports and Exports of an Item (in tonnes) manufactured by a company for the five financial years, 2013-2014 to 2017-2018.

What is the ratio of total Exports to total Imports during the five financial years?View SolutionIn an open economy, the National Income (Y) of the economy is : (C = Consumption, I = Investment, G = Government expenditure, X = Total exports, M = Total import)
View Solution

