COVID-19 Pandemic
The COVID-19 pandemic, also known as coronavirus pandemic, is an ongoing pandemic of coronavirus disease caused by the transmission of severe acute respiratory syndrome coronavirus 2 (SARS-CoV-2) among humans.

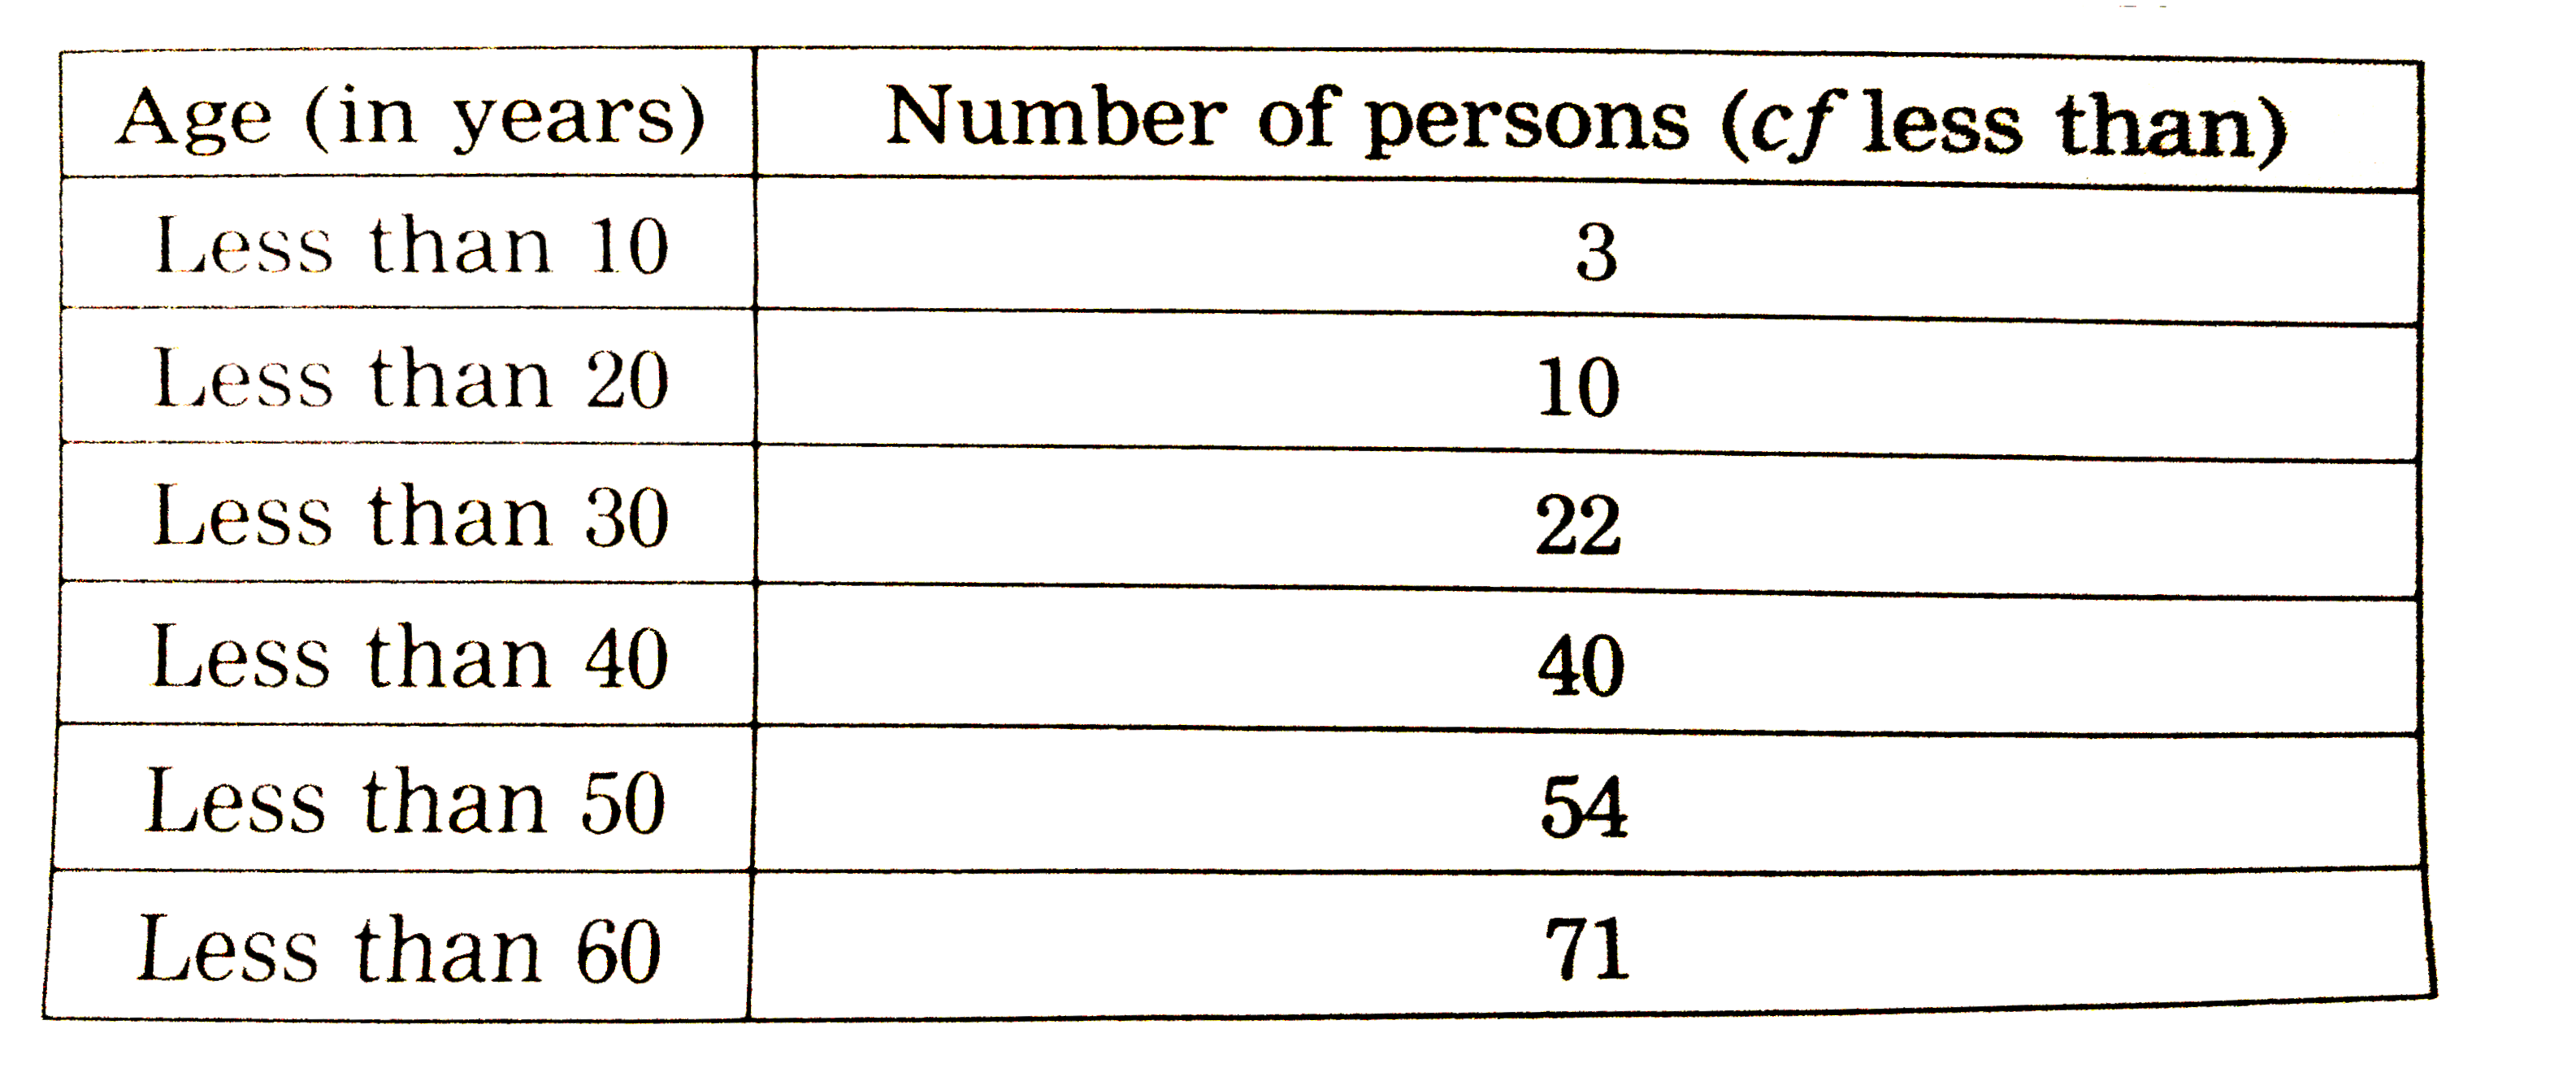
The following tables shows the age distribution of case admitted during a day in two different hospitals .

Refer to table 1.
The average age for which maximum cases occurred is
32.24
34.36
36.84
42.24
The correct Answer is:C
Step by step video & image solution for COVID-19 Pandemic The COVID-19 pandemic, also known as coronavirus pandemic, is an ongoing pandemic of coronavirus disease caused by the transmission of severe acute respiratory syndrome coronavirus 2 (SARS-CoV-2) among humans. The following tables shows the age distribution of case admitted during a day in two different hospitals . Refer to table 1. The average age for which maximum cases occurred is by Maths experts to help you in doubts & scoring excellent marks in Class 10 exams.
Updated on:21/07/2023Topper's Solved these Questions
- STATISTICSBook:OSWAL PUBLICATIONChapter:STATISTICSExercise:Example
Explore 3 Videos
- STATISTICSBook:OSWAL PUBLICATIONChapter:STATISTICSExercise:SELF ASSESSMENT (Multiple choice question)
Explore 2 Videos
- STATISTICSBook:OSWAL PUBLICATIONChapter:STATISTICSExercise:ASSERTION AND REASON BASED MCQs
Explore 4 Videos
- SOME APPLICATIONS OF TRIGONOMETRY (HEIGHTS AND DISTANCES) Book:OSWAL PUBLICATIONChapter:SOME APPLICATIONS OF TRIGONOMETRY (HEIGHTS AND DISTANCES) Exercise:CASE-BASED MCQs
Explore 15 Videos
- SURFACE AREAS AND VOLUMES Book:OSWAL PUBLICATIONChapter:SURFACE AREAS AND VOLUMES Exercise:BOARD CORNER (LONG ANSWER TYPE QUESTIONS)
Explore 9 Videos
Similar Questions
COVID-19 Pandemic
The COVID-19 pandemic, also known as coronavirus pandemic, is an ongoing pandemic of coronavirus disease caused by the transmission of severe acute respiratory syndrome coronavirus 2 (SARS-CoV-2) among humans.

The following tables shows the age distribution of case admitted during a day in two different hospitals .

Refer to table 1.
The mean of the given data is
View SolutionCOVID-19 Pandemic
The COVID-19 pandemic, also known as coronavirus pandemic, is an ongoing pandemic of coronavirus disease caused by the transmission of severe acute respiratory syndrome coronavirus 2 (SARS-CoV-2) among humans.

The following tables shows the age distribution of case admitted during a day in two different hospitals .

Refer to table 1.
The upper limit of modal class is
View Solution
Knowledge Check
Severe acute respiratory syndrome
AIs caused by a variant of pneumococcurs pneumanaeBIs caused by a variant of the common cold virus (corona virus )CIs an acute form of asthmaDAffects non-vegetarians much faster than the vegetariansSevere Acute Respiratory Syndrome (SARS)
AIs caused by a variant of Pneumococcus pneumoniaeBIs caused by a variant of the common cold virus (corona virus)CIs an acute form of asthmaDAffects non-vegetarians much faster than the vegetariansSevere Acute Respiratory Syndrome (SARS)
AIs caused by a variant of PneumococcusBIs caused by a variant of the common cold vitus (corona vairus)CIs an acute form of asthmaDADA deficiency disease in children
COVID-19 Pandemic
The COVID-19 pandemic, also known as coronavirus pandemic, is an ongoing pandemic of coronavirus disease caused by the transmission of severe acute respiratory syndrome coronavirus 2 (SARS-CoV-2) among humans.

The following tables shows the age distribution of case admitted during a day in two different hospitals .

Refer to table 2.
The mode of the given data is
View SolutionCOVID-19 Pandemic
The COVID-19 pandemic, also known as coronavirus pandemic, is an ongoing pandemic of coronavirus disease caused by the transmission of severe acute respiratory syndrome coronavirus 2 (SARS-CoV-2) among humans.

The following tables shows the age distribution of case admitted during a day in two different hospitals .

Refer to table 2.
The median of the given data is
View SolutionThe following table shows the ages of persons who visited a museum on a certain day. Find the median age of the visitors.

View SolutionThe following table shows age distribution of persons in a particular region. Find the: (i) mean age (i)modal age (ii) median age Age?
View SolutionThe following table shows the number of patients of differents age groups admitted to a hospital for treatement on a day. Find the median age of the patients.

View Solution
