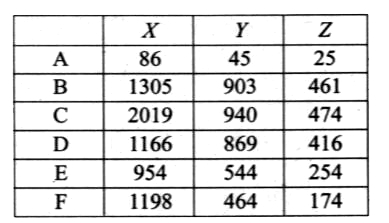
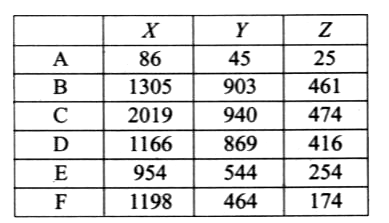
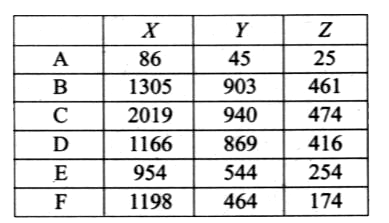
The following data presents count of released convicts who have served prison terms (X), those who have received some educational or technical training during their terms ( Y) and those who were offered. Company placement (Z ) respectively, from six different jails A,B,C,D,E and f, in the year 2010.

Jails with highest and smallest percentage of trained convicts are respectively.
F and D
D and F
C and A
D and A
Step by step video & image solution for The following data presents count of released convicts who have served prison terms (X), those who have received some educational or technical training during their terms ( Y) and those who were offered. Company placement (Z ) respectively, from six different jails A,B,C,D,E and f, in the year 2010. Jails with highest and smallest percentage of trained convicts are respectively. by Maths experts to help you in doubts & scoring excellent marks in Class 14 exams.
Updated on:21/07/2023Similar Questions
The following data presents count of released convicts who have served prison terms (X), those who have received some educational or technical training during their terms ( Y) and those who were offered. Company placement (Z ) respectively, from six different jails A,B,C,D,E and f, in the year 2010.

Jail with highest placement rate of trained convicts is
View SolutionThe following data presents count of released convicts who have served prison terms (X), those who have received some educational or technical training during their terms ( Y) and those who were offered. Company placement (Z ) respectively, from six different jails A,B,C,D,E and f, in the year 2010.

Jails from which more than half of the trained convicts are offered jobs, are
View Solution
Knowledge Check
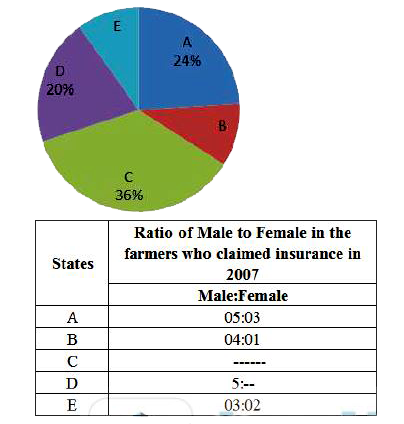
The following pie-chart and table show the percentage distribution of farmers in 5 states A, B, C, D & E of a country who claimed insurance due to drought in the year 2017 and ratio of males to females of the number of farmers in states, respectively. Study the pie-chart and the table carefully and answer the following questions.
Note: Some data are missing in the pie-chart and table, if required in any question, find the missing data first and then answer the question.
Total number of farmers who claimed insurance in the year 2017 = 2,64,000

The number of farmers who claimed insurance in state C exceeds the total number of farmers (who claimed insurance)in state E and state A together by 5280. What is the percentage of farmers who claimed insurance in state E?A0.15B0.25C0.1D0.4Answer the questions on the basis of the information given below.
Venkat, a stockbroker, invested a part of his money in the stock of four companies A, B, C and D. Each of these companies belonged to different industries, viz, Cement, Information Technology (IT), Auto and Steel, in no particular order. At the time of investment, the price of each stock was Rs. 100. Venkat purchased only one stock of each of these companies. He was expecting returns of 20%, 10%, 30% and 40% from the stock of companies A, B, C and D, respectively. Returns are defined as the change in the value of the stock after one year, expressed as a percentage of the initial value. During the year, two of these companies announced extraordinarily good results. One of these two companies belonged to the Cement or the IT industry, while the other one belonged to either the Steel or the Auto industry. As a result, the returns on the stocks of these two companies were higher than the initially expected returns. For the company belonging to the Cement or the IT industry with extraordinarily good results, the returns were twice that of the initially expected returns. For the company belonging to the Steel or the Auto industry, the returns on announcement of extraordinarily the returns were twice that of the initially expected returns. For the company belonging to the Steel or the Auto industry, the returns on announcement of extraordinarily good results were only one and a half times that of the initially expected returns. For the remaining two companies. Which do not announce extraordinarily good results, the returns realized during the year were the same as initially expected.
What is the minimum average return Venkat would have earned during the year?A30%B3114%C3212%DCannot be determined
In the following question, a given question is followed by information in three statements. You have to decide the data in which statement(s) is sufficient to answer the question and mark your answer accordingly.
A, B, C, D, E and F are six employees. Each of them gets different number of mails–15,20,30, 50, 60 and 70 everyday but not necessarily in the same order. Who is the shortest among all and what is the number of mails that D gets?
I. E is taller than only D and F. C is the tallest among all but does not get the least number of mails. A gets half the number of mails of what B gets.
II. A is taller than B. The sum of mails of A and E is equal to the number of mails that D gets. The one, who gets 50 mails is not the shortest. D does not get the highest number of mails.
III. A does not get 15 mails. B is not taller than A. D gets more mails than E but less than C.
View SolutionIn this question below is given a statement followed by three assumption numbered I II and III. you have to considered the statement and the following assumptions decide which of the assumptions is implicit in the statement and choose your answer accordingly.
Statement: The company has recently announced a series of incentives to the employees who are punctual and sincere.
Assumption I. Those who are not punctual at present may get motivated by the announcement.
II. The productivity of the company may increase.
III. The profit earn by the company may be more than the amount to be spent for the incentive programmes.
(a) Only I and II are implicit.
(b) None is implicit.
[c] Only II and III are implicit.
(d) All are implicit
(e) None of these
View SolutionWhile preparing the accounts of company, following issues are faced:
(i) Production Manager is interested in rccording good industrial relations in the accounts.
(ii) Long - term succes of the company is doubtful due to market competition.
(iii) Although sales have not yet taken place , few reliable customers of the company have placed large orders from which huge profit is expected.
(iv) One of the shareholders of the company has invested his savings in shares of another company.
(v) At the end of the accounting period , factory of the company is outstanding for Rs.10 ,000.
(vi) At present , market price of the fixed assets of the company is very high as compared to the book value and directors are intersted to show the fixed assets in accounts at their currennt market price.
(vii) During the year , the company purchased pencils of Rs.50 . These had all been issued from stock and were srill in use at the end of the year.
(viii) Directors are interested to adopt Written Down Value (WDV) Method of charging depreciation in place of Straight Line Method (SLM) in the current accounting period to show higher profit.
(ix) A debtor who owes an amount to the company is likely to be declared insolvent. You are required to (a) state which accounting concept you would following in dealing with each of the above problems and (b) Explain briefly what each concept means.
View SolutionRead the passage given below and answer the questions that follow.
Animal rights
People who support animal rights recognise that all animals have an inherent worth a value completely separate from their usefulness to humans. Every being with a will to live has the right to live free from exploitation and suffering.
All animals have the ability to suffer in the same way and to the same degree that humans do. They feel pain, pleasure, fear, frustration, loneliness, and familial love. Whenever we consider doing something that would interfere with their needs, we are morally obligated to take them into account. People often ask if animal rights mean that animals should have the right to vote or drive a car. Of course, that would be silly because those aren't rights that would benefit animals. But animals have the right not to suffer at the hands of humans and to live their lives free from suffering and exploitation because they have an interest in doing so. That is the difference between equal consideration and equal treatment Almost everyone cares about animals in some context, whether it's a beloved family companion, an irresistibly cute kitten or a majestic wild animal seen in a documentary. After all, we each have some built-in capacity for empathy and compassion, as can be seen from the lengths that children often go to in order to help animals. Logically and morally, there is no reason to differentiate in the way we treat the animals we share our homes with and those who are farmed for food. They are all individuals, with the same capacity to feel pain and fear. Animal rights help us to look past the arbitrary distinctions between different species, to rediscover our innate compassion, and to respect all animals equally. Anyone who cares about animals can start putting these principles into practice every single day with the food they eat, the clothes they wear, and the products they buy. These choices are a form of non-violent protest that makes a real difference both by reducing the profits of corporations that harm or kill animals and by creating a growing market for cruelty-free food, fashion, services, and entertainment.
What do the people who support animal rights recognise?
View SolutionRead the passage given below and answer the questions that follow.
Animal rights
People who support animal rights recognise that all animals have an inherent worth a value completely separate from their usefulness to humans. Every being with a will to live has the right to live free from exploitation and suffering.
All animals have the ability to suffer in the same way and to the same degree that humans do. They feel pain, pleasure, fear, frustration, loneliness, and familial love. Whenever we consider doing something that would interfere with their needs, we are morally obligated to take them into account. People often ask if animal rights mean that animals should have the right to vote or drive a car. Of course, that would be silly because those aren't rights that would benefit animals. But animals have the right not to suffer at the hands of humans and to live their lives free from suffering and exploitation because they have an interest in doing so. That is the difference between equal consideration and equal treatment Almost everyone cares about animals in some context, whether it's a beloved family companion, an irresistibly cute kitten or a majestic wild animal seen in a documentary. After all, we each have some built-in capacity for empathy and compassion, as can be seen from the lengths that children often go to in order to help animals. Logically and morally, there is no reason to differentiate in the way we treat the animals we share our homes with and those who are farmed for food. They are all individuals, with the same capacity to feel pain and fear. Animal rights help us to look past the arbitrary distinctions between different species, to rediscover our innate compassion, and to respect all animals equally. Anyone who cares about animals can start putting these principles into practice every single day with the food they eat, the clothes they wear, and the products they buy. These choices are a form of non-violent protest that makes a real difference both by reducing the profits of corporations that harm or kill animals and by creating a growing market for cruelty-free food, fashion, services, and entertainment.
Anyone who cares about animals can start putting "these principles" into practice. What are "these principles"?
View SolutionRead the passage given below and answer the questions that follow.
Animal rights
People who support animal rights recognise that all animals have an inherent worth a value completely separate from their usefulness to humans. Every being with a will to live has the right to live free from exploitation and suffering.
All animals have the ability to suffer in the same way and to the same degree that humans do. They feel pain, pleasure, fear, frustration, loneliness, and familial love. Whenever we consider doing something that would interfere with their needs, we are morally obligated to take them into account. People often ask if animal rights mean that animals should have the right to vote or drive a car. Of course, that would be silly because those aren't rights that would benefit animals. But animals have the right not to suffer at the hands of humans and to live their lives free from suffering and exploitation because they have an interest in doing so. That is the difference between equal consideration and equal treatment Almost everyone cares about animals in some context, whether it's a beloved family companion, an irresistibly cute kitten or a majestic wild animal seen in a documentary. After all, we each have some built-in capacity for empathy and compassion, as can be seen from the lengths that children often go to in order to help animals. Logically and morally, there is no reason to differentiate in the way we treat the animals we share our homes with and those who are farmed for food. They are all individuals, with the same capacity to feel pain and fear. Animal rights help us to look past the arbitrary distinctions between different species, to rediscover our innate compassion, and to respect all animals equally. Anyone who cares about animals can start putting these principles into practice every single day with the food they eat, the clothes they wear, and the products they buy. These choices are a form of non-violent protest that makes a real difference both by reducing the profits of corporations that harm or kill animals and by creating a growing market for cruelty-free food, fashion, services, and entertainment.
Why should we rediscover our empathy, compassion, and respect for animals?
View Solution
