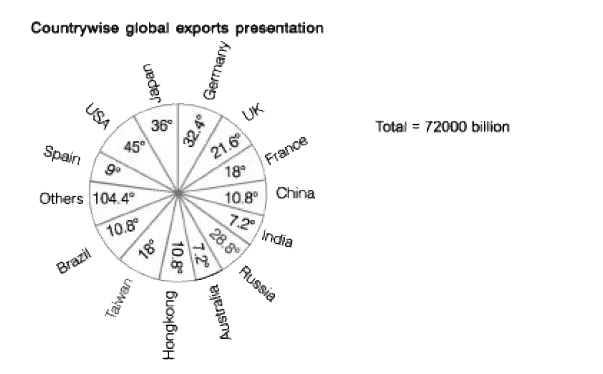
The following Pie chart shows the market share of exporting countres. If a country X constitutes 40% of the share of 'other countries' and the quantity of exports by Country B is Rs 15 million, then the quantity exported by Country X, is :

Rs 4 million
Rs 8 million
Rs 1.6 million
Rs 2 million
The correct Answer is:B
Step by step video, text & image solution for The following Pie chart shows the market share of exporting countres. If a country X constitutes 40% of the share of 'other countries' and the quantity of exports by Country B is Rs 15 million, then the quantity exported by Country X, is : by Maths experts to help you in doubts & scoring excellent marks in Class 14 exams.
Similar Questions
The following pie-chart shows the market share of exporting countries. If the share of a country X is equal to 40% of the share of .other countries. and the volume of exports of the country B is Rs 15 million, then the quantity exported by the country X is:
निम्नलिखित वृत्त आरेख निर्यातक देशों की बाजार हिस्सेदारी को दर्शाता है | यदि देश X की हिस्सेदारी .दूसरे देशों. की हिस्सेदारी के 40% के बराबर है और देश B के निर्यात की मात्रा रु 15 मिलियन है, तो देश द्वारा निर्यात की गई मात्रा है :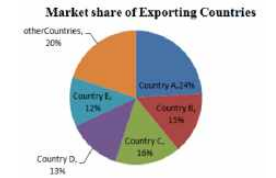 View Solution
The following pie-chart shows the market share of four companies S, T, U and V. Total market is worth Rs.72 crores. Study the pie-chart and answer the questions
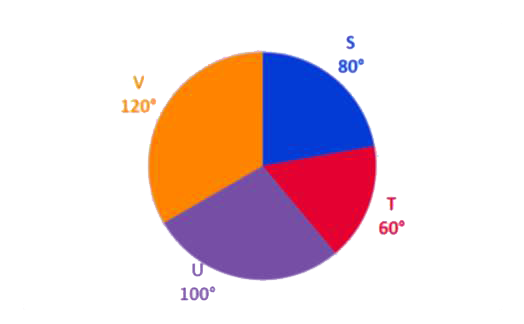
The company having maximum market share isView Solution
Knowledge Check
- Question 1 - Select One
The following table shows the imports and exports (in Rs. Crore) of a country over 4 years (from 2016 to 2019).
 The average trade balanc (in Rs. Crores) is:A12B8C6D4
 - Question 2 - Select One
The following pie-chart shows the market share of four companies S, T, U and V. Total market is worth Rs. 72 crores. Study the pie-chart and answer the questions.
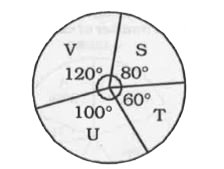
The company having maximum market share isATBUCSDV - Question 3 - Select One
Which of the following commodities is a major item of the export from India to many countries ?
AVegetableBPaddyCTeaDAll of these
The following table shows the imports and exports (in Rs. Crore) of a country over 4 years (from 2016 to 2019).
 The average trade balanc (in Rs. Crores) is:View Solution
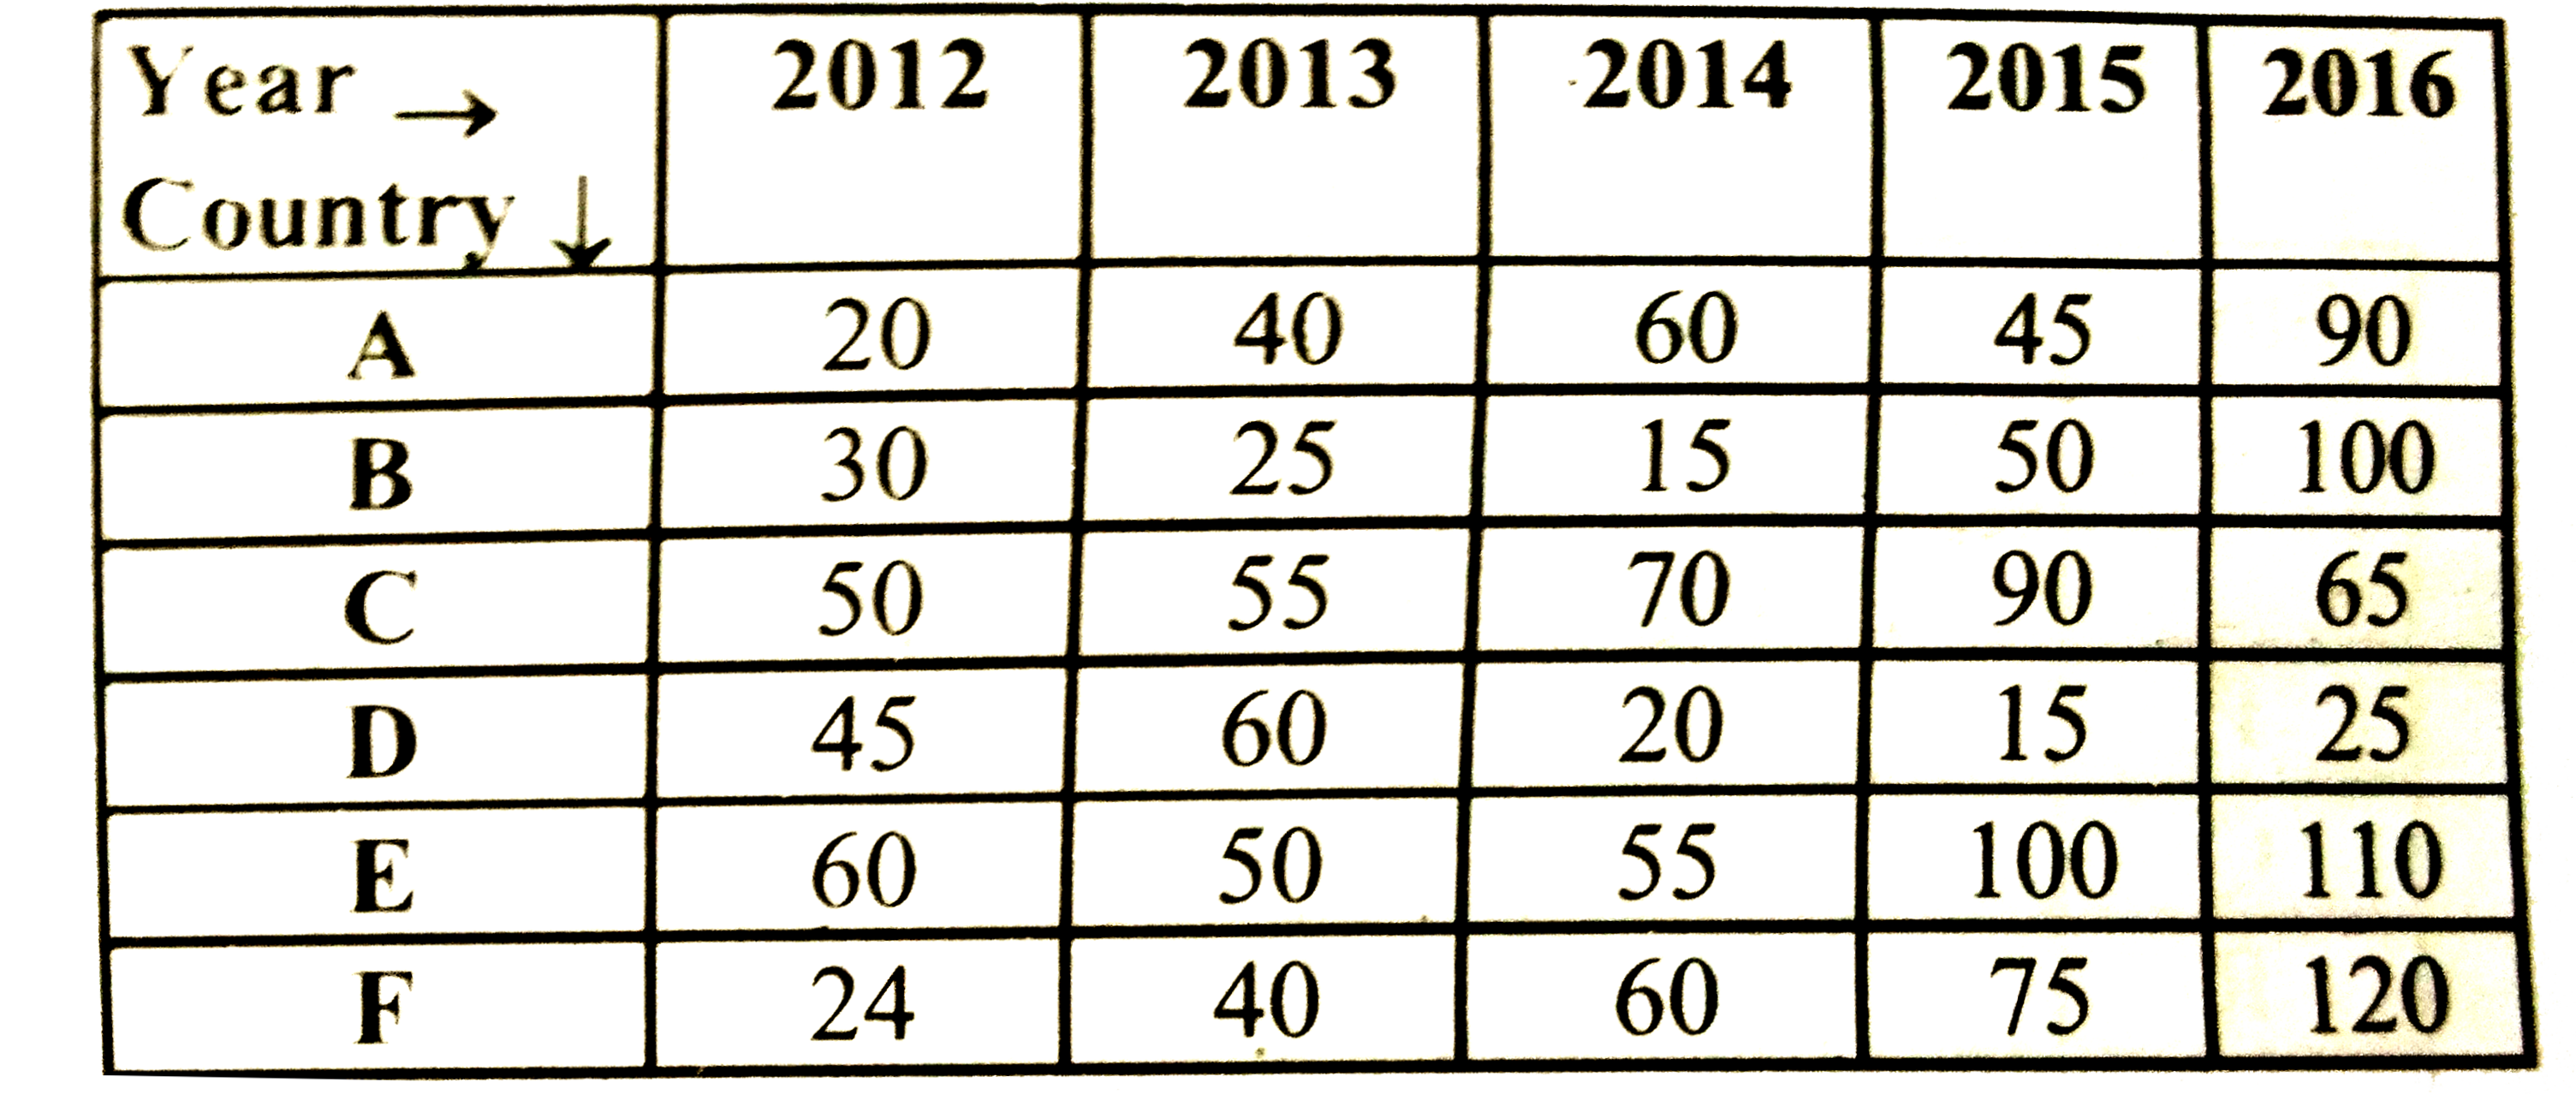
If the respective ratio of export of import in countary D and country F is 1:2and4:1 in the year 2012, then what is the total imports of country F and D together in that particular year ? (in Rs. Corce)View SolutionGiven pie chart shows the expenditure of a country If the total expenditure of thecountry is Rs 180 crores, then what is the expenditure on agriculture ?Security
View SolutionConsidering 'others' as a single country, what is the number of countries whose exports are more than the average exports per country?
 View Solution
The following pie-chart shows the market share of four companies S, T, U and V. Total market is worth Rs. 72 crores. Study the pie-chart and answer the questions.
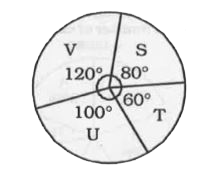
The difference of market shares of companies V and U isView Solution

