The bar chart given below shows the number of flights from by Air India in 6 consecutive years .
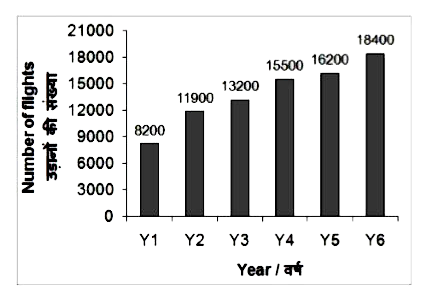
Number of flights of Y2 are what percent of number of flights of Y5?
69.26
71.66
67.18
73.45
The correct Answer is:D
Step by step video, text & image solution for The bar chart given below shows the number of flights from by Air India in 6 consecutive years . Number of flights of Y2 are what percent of number of flights of Y5? by Maths experts to help you in doubts & scoring excellent marks in Class 14 exams.
Similar Questions
The Bar graph shown below presents the number of employees in an office during eight consecutive years.
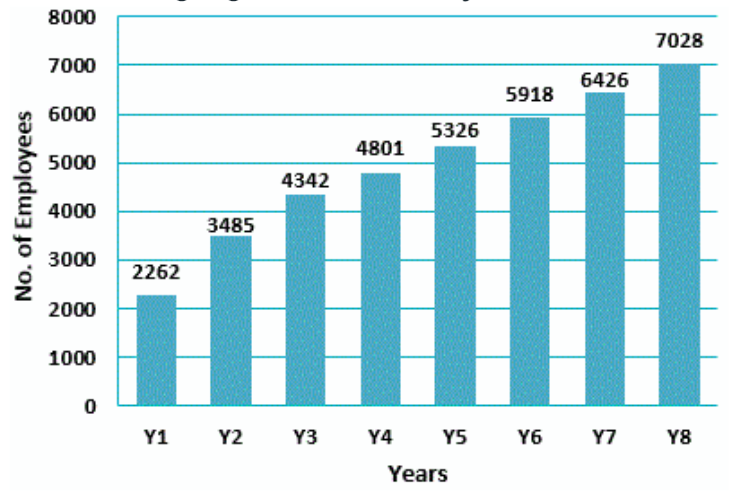
What is the growth percentage in the number of empployees from Y5 to Y6?View SolutionThe pie chart given below shows the number of students in 5 sections .The number of students is 7200.
The number of students in section A is what percent of that of section B?
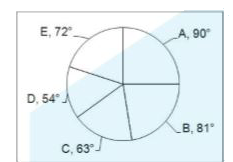 View Solution
Knowledge Check
- Question 1 - Select One
The bar chart given below shows the number of flights from by Air India in 6 consecutive years .
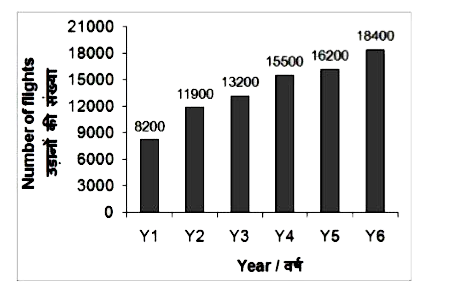
Number flights in Y6 are how much percent more than number of flights in Y1?A124.4B126.8C118.2D114.3 - Question 2 - Select One
The bar chart given below shows the number of flights from Air India in 6 consecutive years .
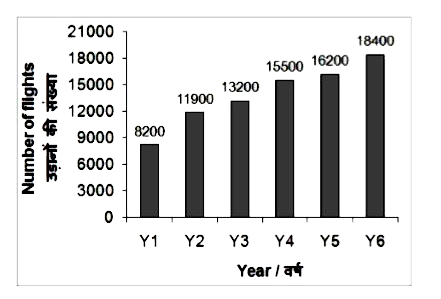
What is average number of flights per year?A14200B13900C13500D14400 - Question 3 - Select One
The bar chart given below shows the number of flights from by Air India in 6 consecutive years .
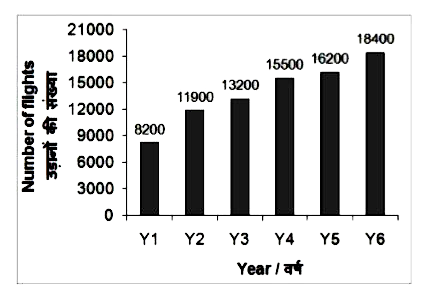
As compared to previous year, which year shows the maximum increase in number of flights? (a) Y4 (b) Y2 (c) Y6 (d) None of theseAY4BY2CY6DNone of these
The bar chart given below shows the number of cars sold by brand A and B for the year for 2008 to 2016
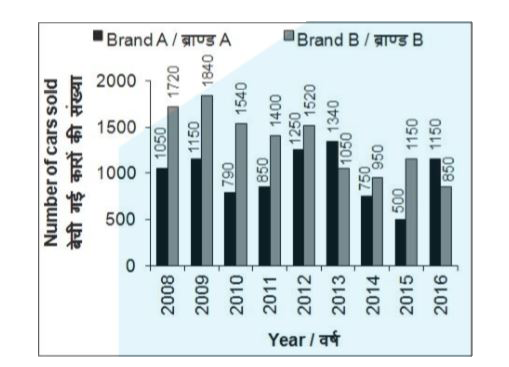
What is the percentage decrease in the number of car sold in year 2015 from year 2014 for brand A?View SolutionThe bar chart given below shows the number of cars sold by brand A and B for the year for 2008 to 2016
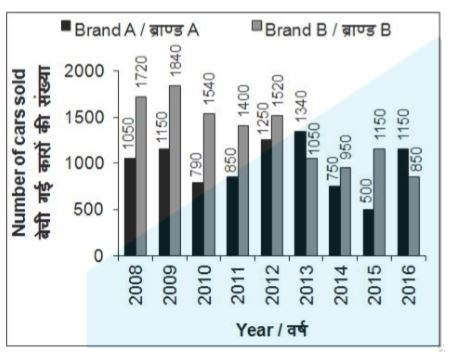
The total sales of the two brands in year 2015 is what percent of the total sales in 2016?View SolutionThe bar chart given below shows the number of staff in colleges A and B from years 2011 to 2016.
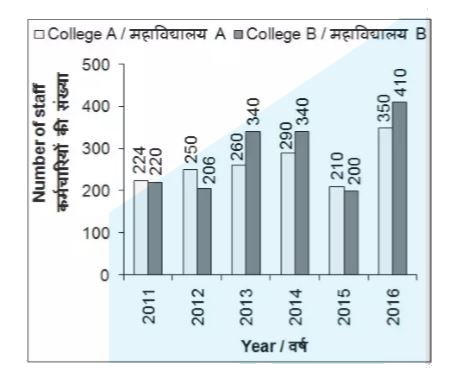
The number of staff in college B is same in which two years?View SolutionThe bar chart given below shows the number of staff in college A and B from years 2011 to 2016.
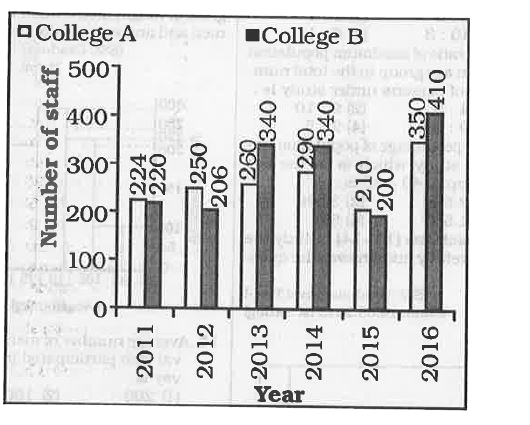
The number of staff in college B is same in which two years?View SolutionThe bar chart given below shows the number of staff in colleges A and B from years 2011 to 2016.
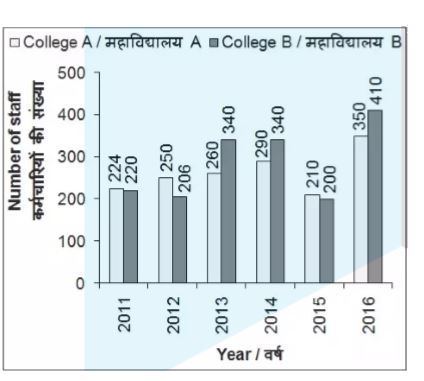
The number of staff in college A in year 2015 is how much percent more than the number of staff in college B in year 2015?View Solution

