The table given below shows the number of students admitted in 2 sections X and Y and from 2011 to 2015.
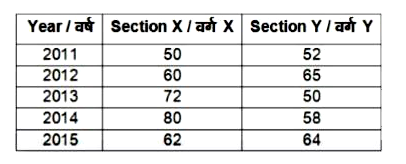
In which two years was the difference in the number of students admitted in the two sections was same?
(a) 2011 and 2012 (b) 2013 and 2014 (c) 2012 and 2015 (d) 2011 and 2015
2011 and 2012
2013 and 2014
2012 and 2015
2011 and 2015
The correct Answer is:A, B, D
Step by step video, text & image solution for The table given below shows the number of students admitted in 2 sections X and Y and from 2011 to 2015. In which two years was the difference in the number of students admitted in the two sections was same? (a) 2011 and 2012 (b) 2013 and 2014 (c) 2012 and 2015 (d) 2011 and 2015 by Maths experts to help you in doubts & scoring excellent marks in Class 14 exams.
Updated on:21/07/2023Similar Questions
The line chart given below shows the number of students in 2 sections X and Y from year 2009 to 2016.
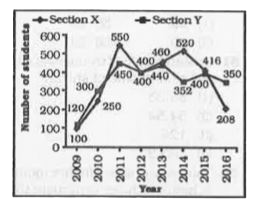
For how many years was the number of students in section Y was more than that of section X?
View SolutionThe line chart given below shows the number of students in 2 sections X and Y from year 2009 to 2016.
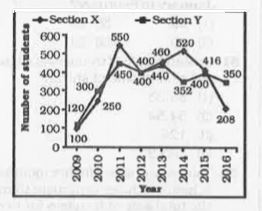
What is the percentage change in the number of students in section Y from year 2011 to year 2015?
View Solution
Knowledge Check
The table given below shows the number of students admitted in 2 sections X and Y from year 2011 to 2015.
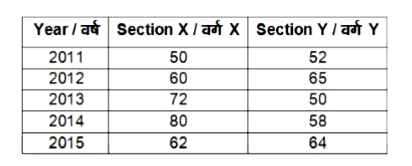
What is the percentage change in the number of students admitted in section Y from year 2011 to 2014?A13.81B11.54C6D58The table given below shows the number of students admitted in 2 sections X and Y from year 2011 to 2015.
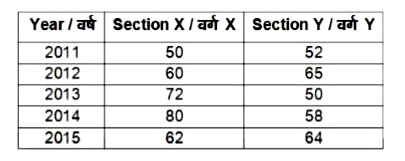
What is the percentage change in the number of students admitted in section X from year 2011 to 2013?A22B50C44D72The table given below shows the number of students adimitted in 2 sections X and Y from year 2011 to 2015.
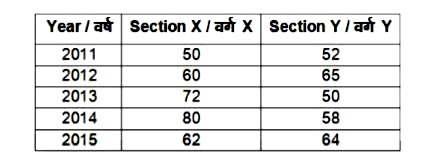
In year 2012, the number of students admitted in section Y is what percent of that of the number of students admitted in section X?A108.33B65C60D200
The line chart given below shows the number of students in 2 sections X and Y from year 2009 to 2016.
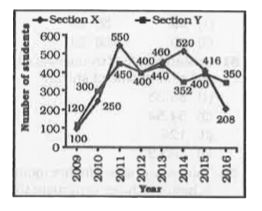
The number of students in section Y in year 2015 is what percentage of the number of students in section X in year 2012?
View SolutionThe table given below shows the number of students who have taken admission in school A and B from the years 2010 to 2015.
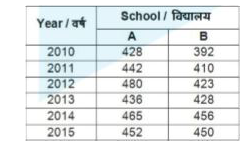
The difference between the number of students in both schools is maximum in which year?
View SolutionThe line chart given below shows the number of students in 2 sections X and Y from year 2009 to 2016.
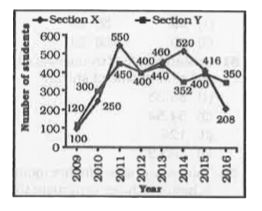
What is the average number of students in section X from year 2009 to year 2014?
View SolutionThe table given below shows the number of students who have taken admission in school A and B from the years 2010 to 2015.
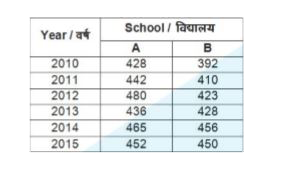
What is the average difference of number of students in school A and B in the given period?
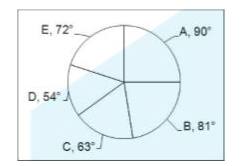
View SolutionThe pie chart given below shows the number of students in 5 sections .The number of students is 7200.
What is the difference between the number of students in section C and section D?
View Solution
