The given pie chart shows information about the mobile phone manufacturing companies in India. The total number mobile phone nimfactured is 12,40,000
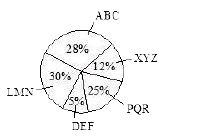
Which company produces the last number of mobile phones?
ABC
PQR
DEF
XYZ
The correct Answer is:C
Step by step video & image solution for The given pie chart shows information about the mobile phone manufacturing companies in India. The total number mobile phone nimfactured is 12,40,000 Which company produces the last number of mobile phones? by Reasoning experts to help you in doubts & scoring excellent marks in Class 14 exams.
Updated on:21/07/2023Similar Questions
The given pie chart shows information about the mobile phone manufacturing companies in India. The total number of mobile phone units manufactured is 12,40,000. How many units of mobile phones wre manufactured by company 'PQR' ?
View SolutionReading of a pie chart for the ratio of 2 mobile phones in different months
View Solution
Knowledge Check
The given pie chart shows information about the mobile phone manufacturing companies in India .The total number of mobile phone units manufactures is 12, 40 , 00 units .
 Which company produces the maximum number of mobile phone ? AXYZBPQRCABCDLMN
The given pie chart shows information about the mobile phone manufacturing companies in India. The total number of mobile phone units manufactured is 12, 40,000

How many units of mobile phones were manufactured by company 'LMN' ?A3,72,000B6,20,000C12,40,000D6,12,000The given pie chart shows information about the mobile phone manufacturing companies in India, The total number of mobile phone units manufactured is 12.40,000.
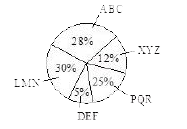
How many units of mobile phones are manufactured by company 'DEF'A224000B62000C31000D15600
Study the following graph carefully and answer the question given below.
The graph gives the three types of mobile phones manufactured by a company over the years.
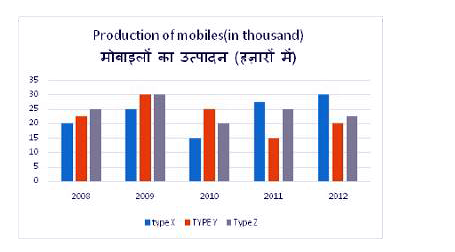
The total number of all the three types of mobiles manufactured was least in which of the following years ?
View SolutionThe given double bar graph shows the sale of mobile phone and cars from 2005 to 2008
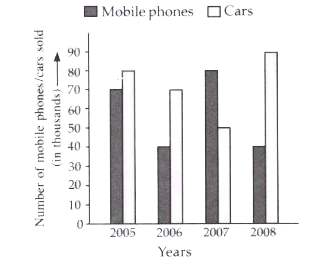
(i) Find the ratio of the tatal number of mobile phones sold in 2006 and 2008 to the total number of cars sold in 2005 and 2007
(ii) What is the average number of cars sold from 2005 to 2008
View SolutionThe given data shows the number of mobiles (in thousands) manufactured by companies C-1, C-2, C-3 and C-4 in 2017, 2018 and 2019.
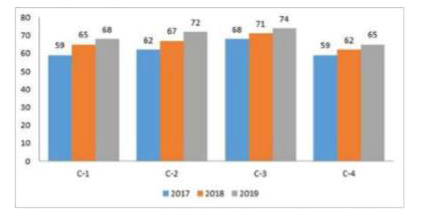
Which company manufactured the least number of mobiles across all the years?
View SolutionThe given data shows the number of mobiles (in thousands) manufactured by companies C-1, C-2, C-3 and C-4 in 2017, 201S and 2019.
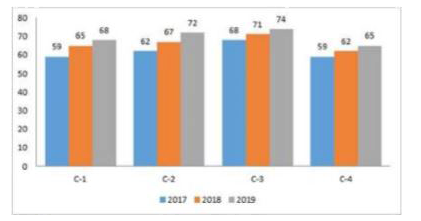
Which company manufactured the highest number of mobiles across all the years?
View SolutionIn this question, sentence is given with blank to be filled in with an appropriate word. Four alternatives are suggested for question. Choose the correct alternative out of the four.
Mobile phones __ popular in India in the last five years.
View Solution
