The pie chart given below shows the annual snowfall received by 7 states of a country. The snowfall is shown as a percentage of total annual snowfall of the country.
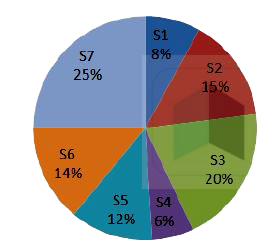
If the annual snowfall received by the country is 700 cm. What is the difference in the annual snowfalls of S3 and S2?
A) 42cm
B) 7cm
C) cannot be determined
D) 35 cm
The correct Answer is:D
Step by step video, text & image solution for The pie chart given below shows the annual snowfall received by 7 states of a country. The snowfall is shown as a percentage of total annual snowfall of the country. If the annual snowfall received by the country is 700 cm. What is the difference in the annual snowfalls of S3 and S2? by Maths experts to help you in doubts & scoring excellent marks in Class 14 exams.
Similar Questions
Given pie chart shows the expenditure of a country If the total expenditure of thecountry is Rs 180 crores, then what is the expenditure on agriculture ?Security
View SolutionThe annual incomes of two persons are in the ratio 9:7 and their expenses are in the ratio 4:3. If each of them saves Rs. 2,000 per year, what is the difference in their annual incomes?
View Solution
Knowledge Check
- Question 1 - Select One
The pie chart given below shows the annual snowfall received by 7 states of a country. The snowfall is shown as a percentage of total annual snowfall of the country.
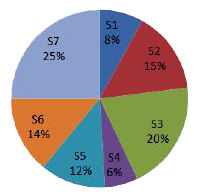
If the annual snowfall received by the country is 700 cm, then what is the monthly snowfall received by S5?A7 cmB5 cmC21 cmD12 cm - Question 2 - Select One
The pie chart given below shows the imports of 7 different items P1, P2, P3, P4, PS, P6 and P7 as a percentage of total imports of a country.
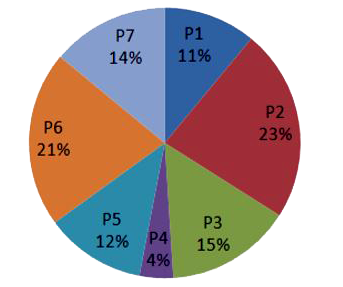
Imports of item P6 is how much percent more than the imports of item P5?A75%B33%C80%D9% - Question 3 - Select One
The pie chart given below shows the number of female students in different subjects. The number of female students in a particular subject are shown as a percentage of total number of female students in all the subjects together.
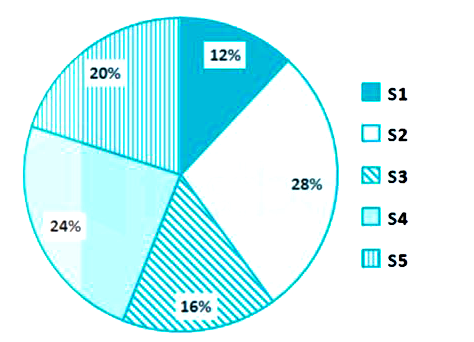
If the total number of female students are 3600, then what is the difference in number of female students in subjects S1 and S4?A412B400C432D456
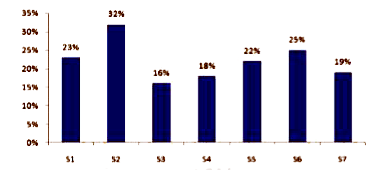
The bar chart given below shows the amount of sugar used in making 7 different varieties of sweets S1, S2, S3, S4, S5, S6 and S7 has been show as a percentage of total weight of the sweet.
The total weight of sweet S4 is 150 kg. What is the amount of sugar used in sweet S4
? View Solution
The pie chart given below shows the imports of 7 different items P1, P2, P3, P4, PS, P6 and P7 as a percentage of total imports of a country.
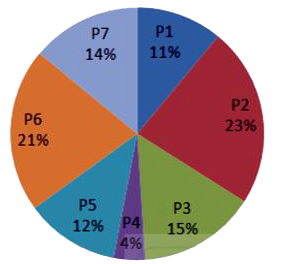
If the total import of item P1 is ₹ 33000, then what is the value of imports of item P2?View SolutionThe pie chart shows the value of the total annual production of dry fruits of a country. Study the diagram and answer the following questions.
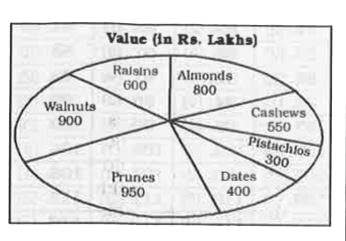
What is the total value (in Rs. lakhs) of the annual dry fruit production of the country?View SolutionThe pie chart shows the value of the total annual production of dry fruits of a country. Study the diagram and answer the following questions.

What is the total value (in Rs. lakhs) of the annual dry fruit production of the country?View SolutionThe pie chart shows the value of the total annual agricultural production of a country. Study the diagram and answer the following questions.
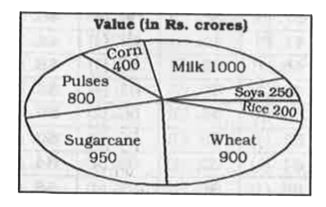
What is the total value (in Rs. crores) of the annual agricultural production of the country?View Solution

