An important problem in fishery science is to estimate the number of fish presently spawning in streams and use this information to predict the number of mature fish or "recruits" that will return to the rivers during the reproductive period. If S is the number of spawners and R the number of recruits, "Beverton-Holt spawner recruit function" is R(S)=S(αS+β) where α and β are positive constants. Show that this function predicts approximately constant recruitment when the number of spawners is sufficiently large.
The correct Answer is:1α
Topper's Solved these Questions
- BOOK - NCERT TAMILCHAPTER - DIFFERENTIAL CALCULUS - LIMITS AND CONTINUITYEXERCISE - EXERCISE 9.427videos
DIFFERENTIAL CALCULUS - LIMITS AND CONTINUITY
- BOOK - NCERT TAMILCHAPTER - DIFFERENTIAL CALCULUS - LIMITS AND CONTINUITYEXERCISE - EXERCISE 9.525videos
DIFFERENTIAL CALCULUS - LIMITS AND CONTINUITY
- BOOK - NCERT TAMILCHAPTER - DIFFERENTIAL CALCULUS - LIMITS AND CONTINUITYEXERCISE - EXERCISE 9.214videos
DIFFERENTIAL CALCULUS - LIMITS AND CONTINUITY
- BOOK - NCERT TAMILCHAPTER - CONIC SECTIONSEXERCISE - Miscellaneous Exercise8videos
CONIC SECTIONS
- BOOK - NCERT TAMILCHAPTER - DIFFERENTIAL CALCULUS-DIFFERENTIABILITY AND METHODS OF DIFFERENTIATION EXERCISE - EXERCISE 10.525videos
DIFFERENTIAL CALCULUS-DIFFERENTIABILITY AND METHODS OF DIFFERENTIATION
Similar Questions
Knowledge Check
- Question 1 - Select One
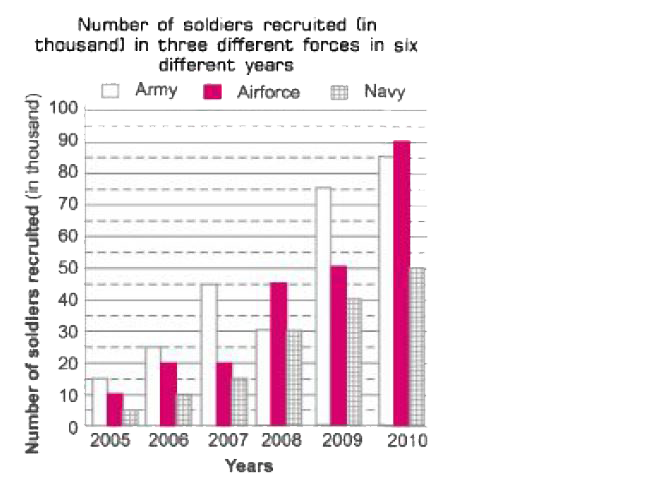
What was the average number of soldiers recruited in the navy over all the years together?
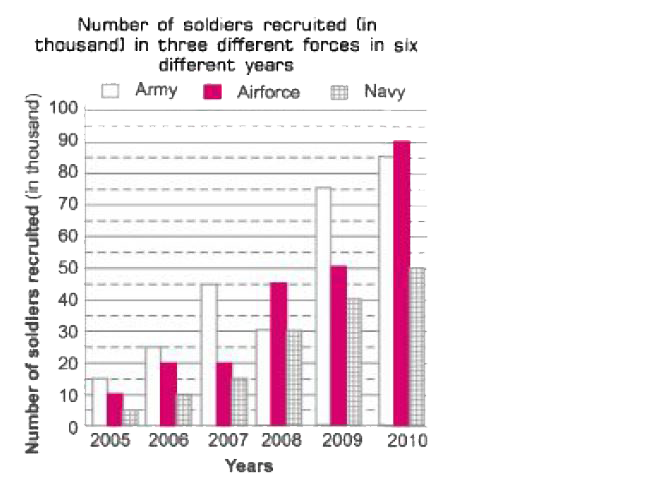 A25000B24000C2400D28000
 - Question 2 - Select One
What was the respective ratio between the number of soldiers recruited for airforce in the year 2005 and the number of soldiers recruited in army in the year 2009?
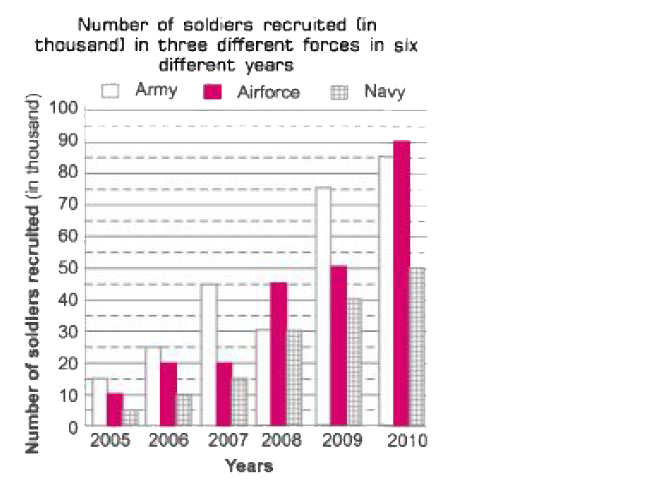 A2:15B5:13C2:17D15:4
 - Question 3 - Select One
The given table represents the number of engineers recruited by four companies A,B,C and D over the years. Study the table carefully and answer the questions that follows: The total number of engineers recruited by the company B in 2014 and 2017 is what percentage of the total number of engineers recruited by C during 2015 to 2019?
दी गयी तालिका चार कंपनियों A, B, C और D के द्वारा इन वर्षों के दौरान भर्ती किये गए इंजीनियरों की संख्या दर्शाती है | इस तालिका का ध्यानपूर्वक अध्ययन करें तथा इसके बाद पूछे गए प्रश्न का उत्तर दें |
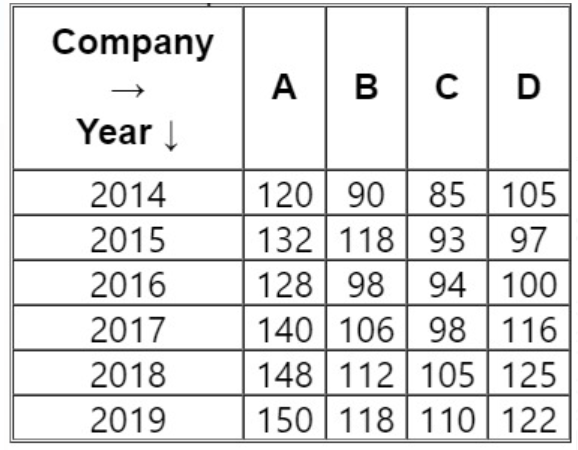
कंपनी B के द्वारा 2014 और 2017 में भर्ती किये गए इंजीनियरों की कुल संख्या C के द्वारा 2015 से 2019 के दौरान भर्ती किये गए इंजीनियरों की कुल संख्या का कितना प्रतिशत है ?A38.2B38.4C37.8D39.2
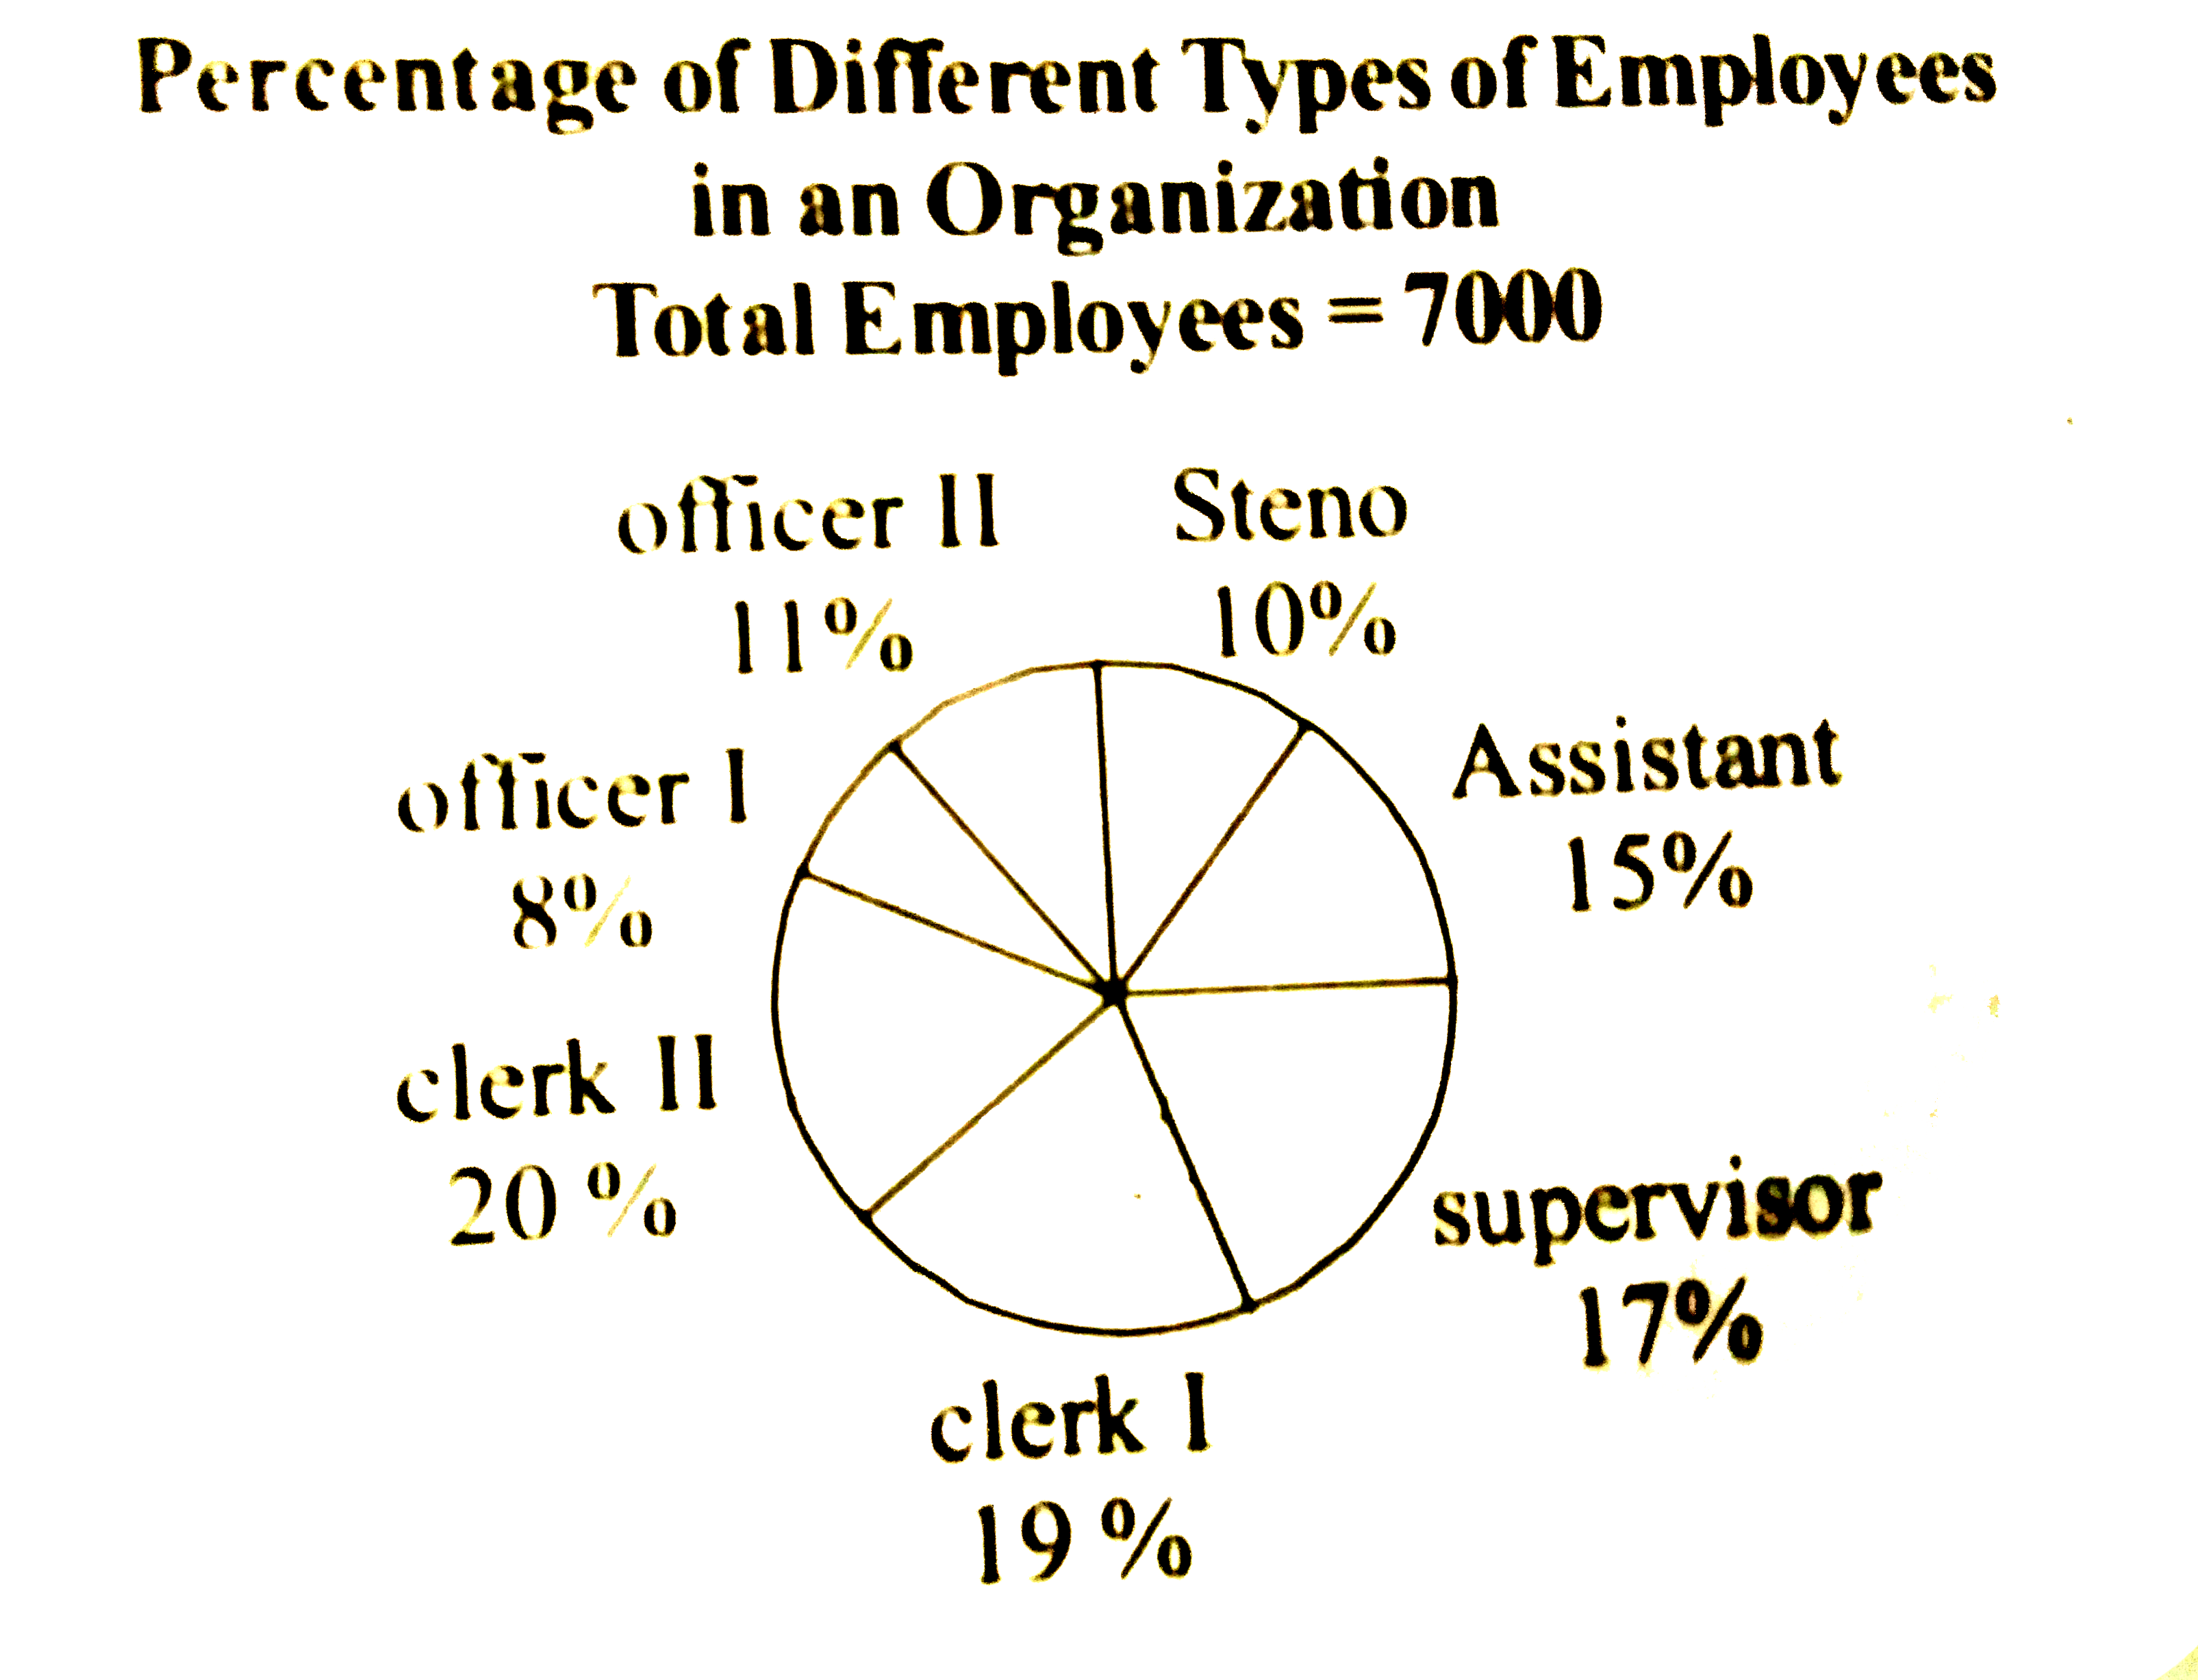

Which type of employees has maximum number of direct recruits ?View SolutionBriefly enumerate the important sources of recruitment.
View SolutionIf r and s are two positive numbers and r is 25% greater than s, what is the value of the ratio r/s?
View SolutionThe given table represents the number of engineers recruited by four companies A,B,C and D over the years. Study the table carefully and answer the questions that follows: The number of years in which the number of engineers recruited by company D is less than the average number of engineers recruited by company B in the given six years, is:
दी गयी तालिका चार कंपनियों A, B, C और D के द्वारा इन वर्षों के दौरान भर्ती किये गए इंजीनियरों की संख्या दर्शाती है | इस तालिका का ध्यानपूर्वक अध्ययन करें तथा इसके बाद पूछे गए प्रश्न का उत्तर दें |
ऐसे कितने वर्ष हैं जिनमें कंपनी D के द्वारा भर्ती किये गए इंजीनियरों की संख्या दिए गए छः वर्षों की अवधि में कंपनी B के द्वारा भर्ती किये गए इंजीनियरों की औसत संख्या से कम है?View SolutionNumber of soldiers recruited in navy in the year 2009 was what percentage of number of soldiers recruited in army in the year 2006?
 View Solution

