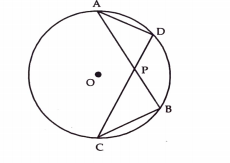
In the figure
 AB and CD are two chords of a circle, intersecting each other at P such that AP = CP show thawt AB = CD.Solution in Punjabi
Step by step video & image solution for In the figure AB and CD are two chords of a circle, intersecting each other at P such that AP = CP show thawt AB = CD. by Maths experts to help you in doubts & scoring excellent marks in Class 9 exams.
Updated on:21/07/2023Topper's Solved these Questions
- CIRCLESBOOK - MODERN PUBLICATIONCHAPTER - CIRCLESEXERCISE - EXERCISE
94 Videos
- AREA OF PARALLELOGRAMS AND TRIANGLESBOOK - MODERN PUBLICATIONCHAPTER - AREA OF PARALLELOGRAMS AND TRIANGLESEXERCISE - EXERCISE
83 Videos
- CONSTRUCTIONSBOOK - MODERN PUBLICATIONCHAPTER - CONSTRUCTIONSEXERCISE - EXERCISE
69 Videos
Similar Questions
The radius of a circle is 8 cm and the length of its chords is 12 cm. Fid the distance of the from the centre.
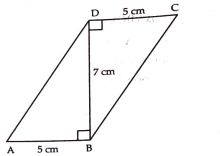
View SolutionIn the figure. Show that ABCD is a parallelogram.
 Calculate the area of ||gm ABCD.
View SolutionDraw a line segment of length 7.3 cm using a ruler.
View SolutionIn Figure, AB and CD are two chords of a circle, intersecting each other at P such that AP=CP. Show that AB=CD
View SolutionIn the given figure (not to scale), O is the centre of the circle. A,B,C and D are concyclic and AB=CD . If /_MON =120^(@) , then find /_ OPN .
View SolutionHow many lines of symmetry does the above figure have ?
View SolutionDetermine the point of symmetry of a regular hexagon.
View SolutionDtermine the images of the following figure about the given line :
View SolutionIn the figure above (not to scale), ¯¯¯¯¯¯AB⊥¯¯¯¯¯¯CDandAD is the bisector of ∠BAE.AB=3cm and AC=5cm. Find CD.
View SolutionIn the given figure, AB is a diameter, O is the center of the circle and ∠OCB=50∘ then find ∠DBC.
View SolutionMatch the following Column A to Column B

View SolutionMatch the following Column A to Column B

View SolutionMatch the following Column A to Column B

View SolutionThe inequation represented by the graph given below is :
View SolutionThe inequation that best describes the graph given below is _________
View SolutionThe inequation that best describes the following graph is _________
View Solution
