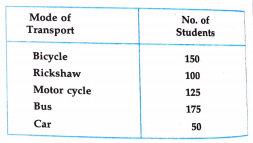
600 students of a school use different mode of transport to go to school s below

Draw the bar graph representing the above data.Solution in Punjabi
Step by step video & image solution for 600 students of a school use different mode of transport to go to school s belowDraw the bar graph representing the above data. by Maths experts to help you in doubts & scoring excellent marks in Class 9 exams.
Updated on:21/07/2023Topper's Solved these Questions
Similar Questions
Define
Statistics as a subject.
View SolutionThree angles of a quadrilteral are respectively 50∘ and 110∘ and 100∘ . Find the fourth angles.
View SolutionFind the lateral surface and total surface area of a cuboid of length 80 cm, breadth 40 cm and height 20 cm.
View SolutionHow many lines of symmetry does the above figure have ?
View SolutionDetermine the point of symmetry of a regular hexagon.
View SolutionDraw the bisector of ∠AOB=58∘
ltimg src="https://d10lpgp6xz60nq.cloudfront.net/physics_images/PS_MATH_VII_C05_S01_009_Q01.png" width="80%"gt
View SolutionMatch the following Column A to Column B

View SolutionMatch the following Column A to Column B

View SolutionMatch the following Column A to Column B

View SolutionFind the area of figure given below.

View SolutionFind the perimeter of the figure given below.

View SolutionFind the area of the figure given below.

View SolutionThe area of the shaded part in the figure given below is ______.

View SolutionThe inequation represented by the graph given below is :
View SolutionThe inequation that best describes the graph given below is _________
View SolutionThe inequation that best describes the following graph is _________
View Solution
