Directions: The following table shows the number of bananas sold by 5 fruit sellers and the relation of
apples with bananas in 3rd column. Read the table carefully and answer the following question.

The total fruits sold by B is approximately what percent of the total fruits sold by D?
0.75
0.85
0.8
0.9
Step by step video & image solution for Directions: The following table shows the number of bananas sold by 5 fruit sellers and the relation of apples with bananas in 3rd column. Read the table carefully and answer the following question. The total fruits sold by B is approximately what percent of the total fruits sold by D? by Reasoning experts to help you in doubts & scoring excellent marks in Class 14 exams.
Similar Questions
The following table shows the number of fruits in a fruit shop. Represent the above data by a bar graph
View SolutionDirection: The given bar graph shows the number of pens sold by two shops A & B in four consecutive months. Study the following data and answer the following questions:
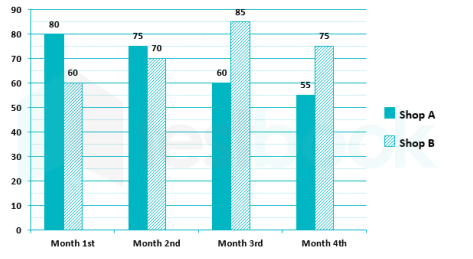
Find that the number of pens sold by shop A in 1st month is how much percent more than the number of pens sold by shop A in 3rd month.View Solution
Knowledge Check
- Question 1 - Select One
Directions: The following table shows the number of bananas sold by 5 fruit sellers and the relation of apples with bananas in 3rd column. Read the table carefully and answer the following question.

Had Apples sold by A is only 10% more than bananas sold by A, then find the ratio of the total number of bananas sold by B, C and E to the total number of apples sold by A, D and E.A21:19B1:1C13:15D2:3 - Question 2 - Select One
Study the following table carefully and answer the questions given below:
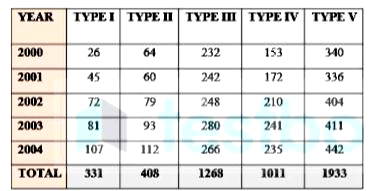
The number of Type I veb.icles sold in 2003 was approximately what percentage of the total number of vehicles sold in 2002?A8B9C10D11 - Question 3 - Select One
Study the graph carefully and answer the following questions.
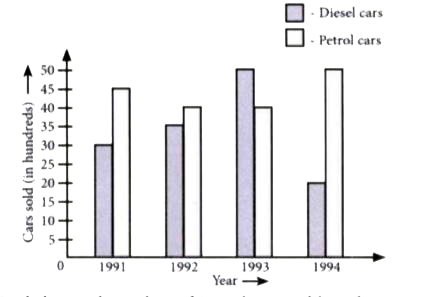
Find the total number of Diesel cars sold in the year 1992 and 1994 together.A2500B5500C1500D4500
Study the pie chart and answer the question
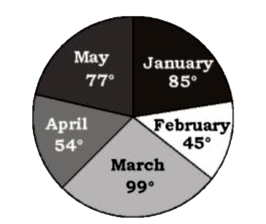
The total number of computers sold in February and April is what percentage more than the number of computers sold in MayView SolutionStudy the table carefully to answer the questions that follow-
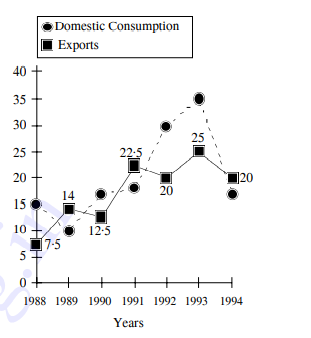
What is the approximate average number of units sold in the year 1999?View SolutionThe given table represents the number of computers sold by four dealers A, B, C and D during the first six months of 2016. Study the table carefully and answer the question that follows.
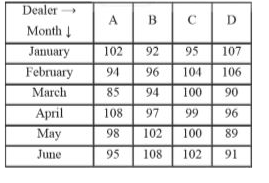
The total number of computers sold by dealer B in April, May and June is what percentage of the total number of computers sold by all the dealers in February and April?View SolutionDirections: The following table presents the number of units of the product produced and sold by a company during six years
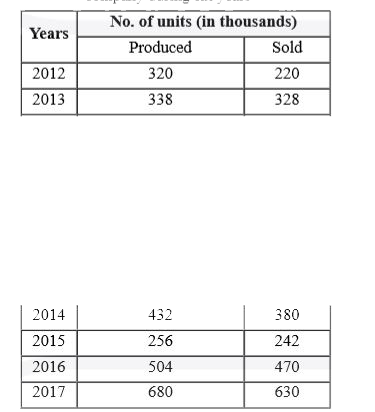
Find the ratio between total production and total salesView SolutionStudy the table carefully to answer the questions that follow-
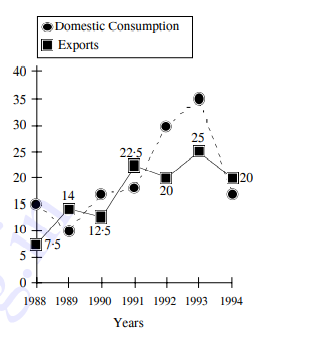
Which company has sold the maximum number of units over the years?View Solution

