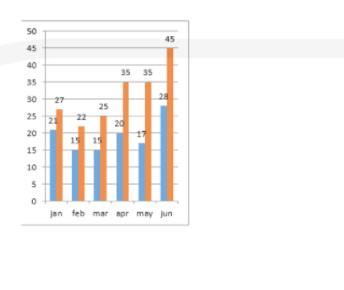
The given data shows the registration of bikes and total vehicles (in thousands) for 6 months in 2017 in City X.
Note: In the chart, the first number represents bikes and the second number represents total vehicles.
Based on the given data, from January to April 2017, the increase in the registration of vehicles other than bikes is ________ .
8000
9050
8500
9000
Step by step video & image solution for The given data shows the registration of bikes and total vehicles (in thousands) for 6 months in 2017 in City X. Note: In the chart, the first number represents bikes and the second number represents total vehicles. Based on the given data, from January to April 2017, the increase in the registration of vehicles other than bikes is ________ . by Maths experts to help you in doubts & scoring excellent marks in Class 14 exams.
Similar Questions
The inequation represented by the graph given below is :
02:10View SolutionThe inequation that best describes the graph given below is _________
02:17View SolutionThe inequation that best describes the following graph is _________
02:10View SolutionWhich inequations represent the shaded region in the given figure
04:23View SolutionMatch the items given in column A and B: ltimg src="https://d10lpgp6xz60nq.cloudfront.net/physics_images/NCERT_BIO_XII_C16_E01_004_Q01.png" width="80%"gt
06:00View SolutionA vehicle registration number consists of 2 letters of english alphbets followed by 4 digits ,where the first digit is not zero . Then the total number of vehicles with distinct registration number is -
01:49View Solutionएक वाहन का रजिस्ट्रेशन नंबर में दो शब्द अंग्रेजी वर्णमाला के और 4 अंक शामिल है जहाँ पहला अंक शून्य नहीं है तब भिन्न प्रकार के वाहनों की रजिस्ट्रेशन नंबर की संख्या है,
03:09View SolutionThe total surface area of the given solid figure is _______________.
 01:52View Solution

