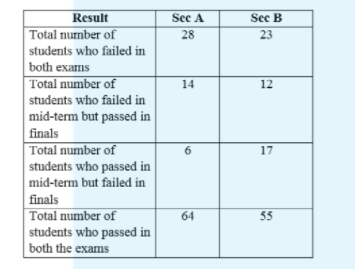
The following table gives the details of the number of students in Class 10 section A and B who had taken mid-term and final exam.
The percentage of students in section A is _________ (round to one decimal).
51
51.1
51.3
51.2
Step by step video & image solution for The following table gives the details of the number of students in Class 10 section A and B who had taken mid-term and final exam. The percentage of students in section A is _________ (round to one decimal). by Maths experts to help you in doubts & scoring excellent marks in Class 14 exams.
Similar Questions
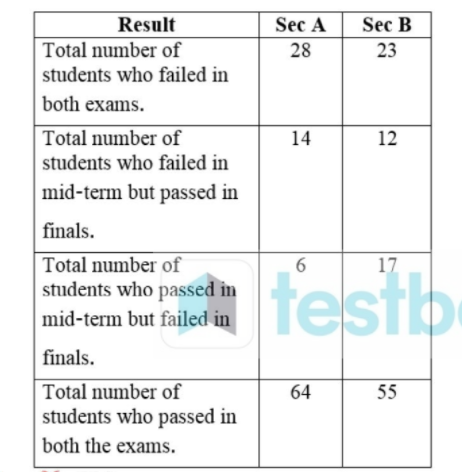
The below table gives the details of the number of students in Class 10, section A and B who had taken mid-term and final exam. What is the total number of students in both, section A and B?
 View Solution
The pie chart given below sows the number of students in 6 different sections. The total number of students is 1800.
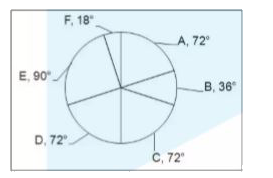
What is the average number of students in section A, B and F?View Solution
Knowledge Check
- Question 1 - Select One
Read the information given below and answer the questions that follow:
Following table gives the data on the number of students who appeared, qualified and were selected from various states in a national level exam.
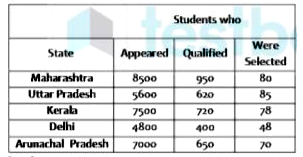
What percentage of students who appeared in the exam were selected?A1.08%B0.90%C1.2%D2.11% - Question 2 - Select One
The pie chart given below shows the number of students in 5 sections .The number of students is 7200.
The number of students in section A is what percent of that of section B?
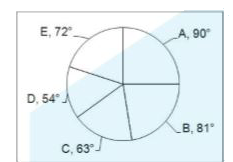 Aa)90Bb)110Cc)109Dd)111.11
 - Question 3 - Select One
The line chart given below shows the number of students in 2 sections X and Y from year 2009 to 2016.
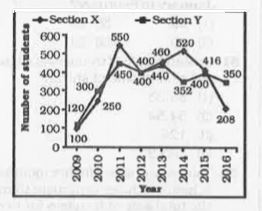
What is the percentage change in the number of students in section Y from year 2011 to year 2015?A25B50C11.11D10
Following table gives the distribution of students of sections A and B of a class according to the marks obtained by them.
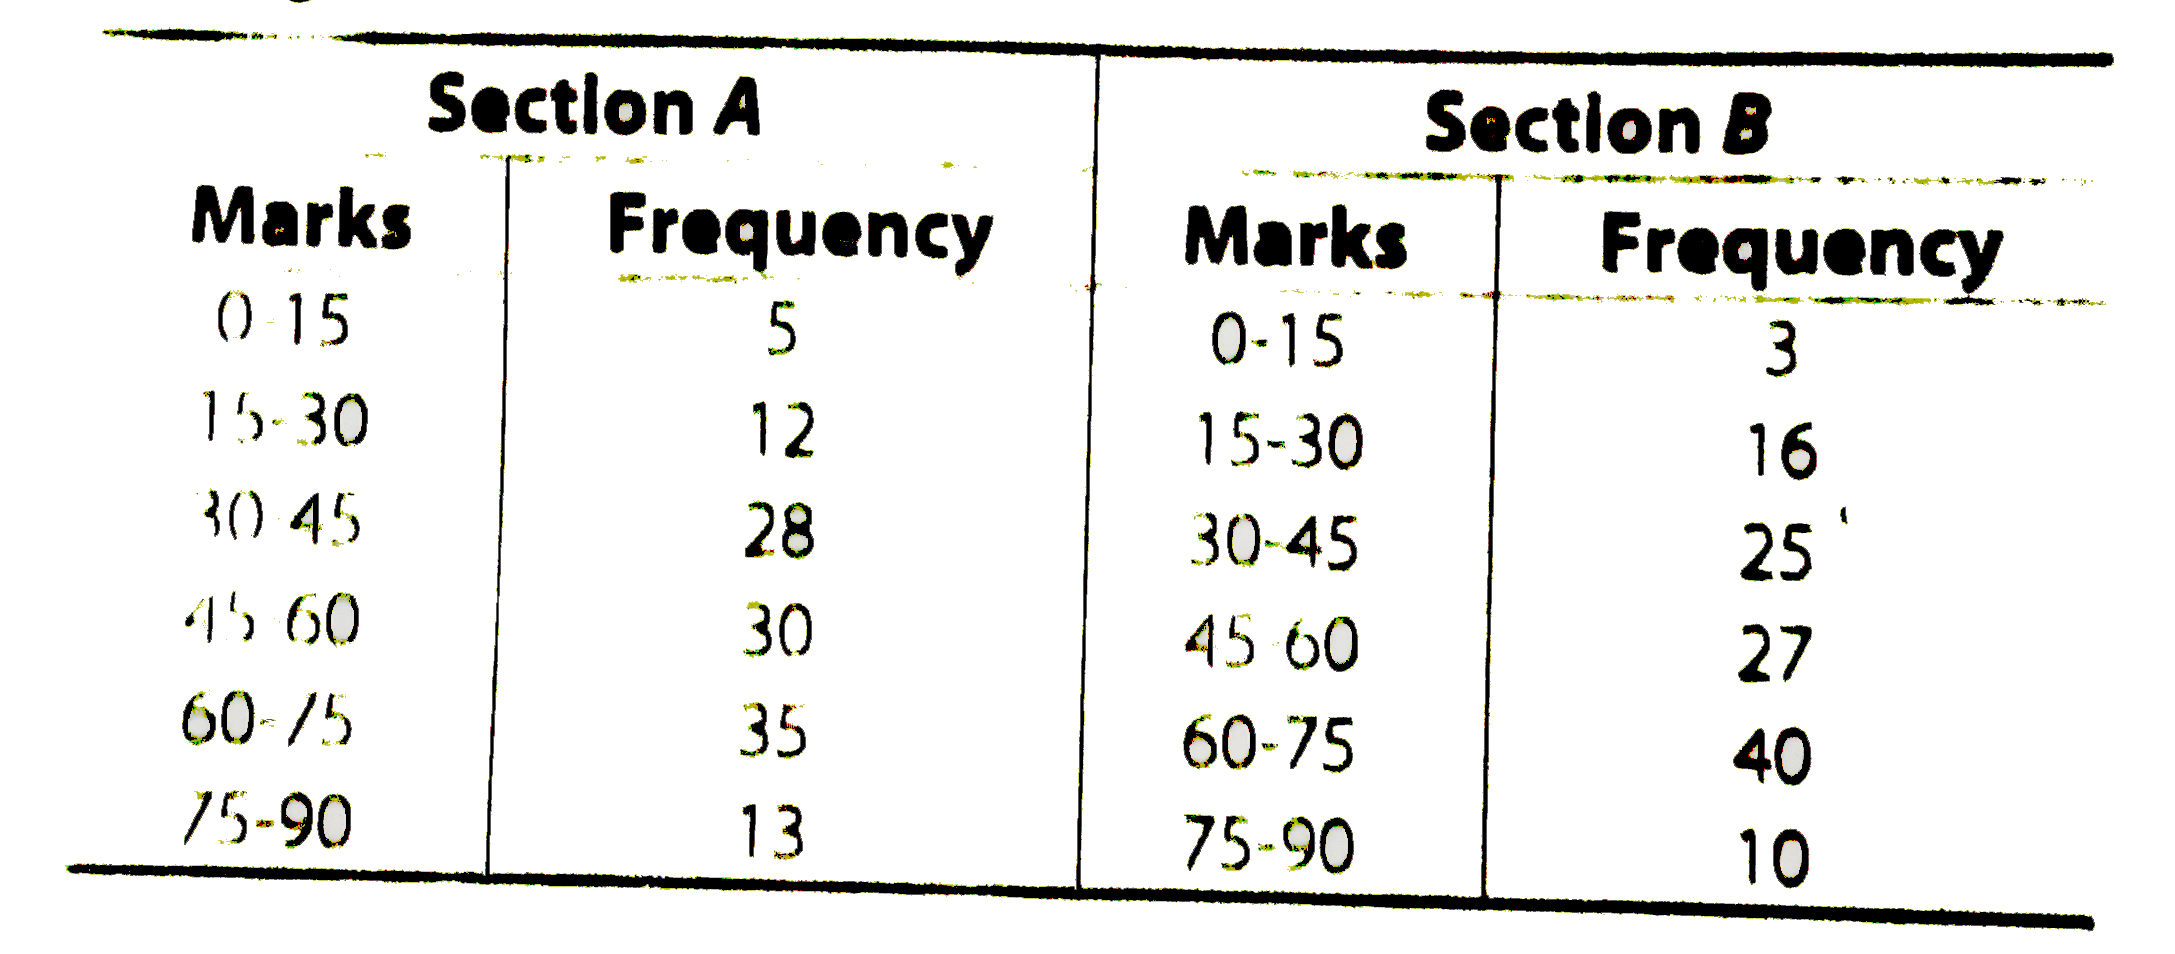
Represent the marks of the students of both the sections on the same graph by two frequency polygons. What do you observe?View SolutionThe following table gives the distribution of students of two sections according to the marks obtained by them. Represent the marks of the students of botht the sections on the same graph by two frequency polygon. From the two polygons compare the performance of the two sections.
View SolutionThe pie chart given below shows the number of students in 5 sections .The number of students is 7200.
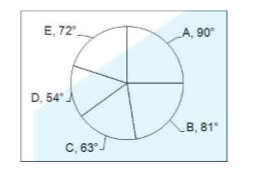
What is the total number of students in section E and section B?View SolutionThe table given below shows the number of students admitted in 2 sections X and Y from year 2011 to 2015.
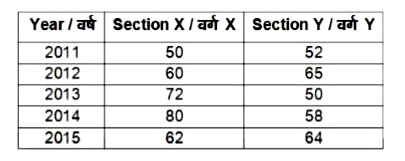
What is the percentage change in the number of students admitted in section X from year 2011 to 2013?View SolutionThe table given below shows the number of students admitted in 2 sections X and Y from year 2011 to 2015.
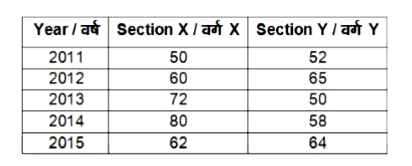
What is the percentage change in the number of students admitted in section Y from year 2011 to 2014?View Solution

