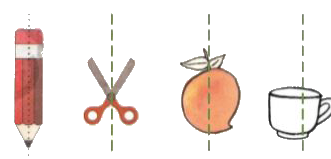
In the figures given below find which are symmetric figures.

Can we find line of symmetry for every figure?Solution in Telugu
Step by step video & image solution for In the figures given below find which are symmetric figures. Can we find line of symmetry for every figure? by Maths experts to help you in doubts & scoring excellent marks in Class 6 exams.
Updated on:21/07/2023Topper's Solved these Questions
- SYMMETRYBOOK - NCERT TELUGUCHAPTER - SYMMETRYEXERCISE - Try These
10 Videos
- SYMMETRYBOOK - NCERT TELUGUCHAPTER - SYMMETRYEXERCISE - Think, Discuss And Write
4 Videos
- SYMMETRYBOOK - NCERT TELUGUCHAPTER - SYMMETRYEXERCISE - Exercise - 12.2
30 Videos
- SUMMATIVE ASSESMENTBOOK - NCERT TELUGUCHAPTER - SUMMATIVE ASSESMENTEXERCISE - SUMMATIVE ASSESMENT
151 Videos
- UNDERSTANDING 3D AND 2D SHAPESBOOK - NCERT TELUGUCHAPTER - UNDERSTANDING 3D AND 2D SHAPESEXERCISE - EXERCISE
52 Videos
Similar Questions
Write the letters of English alphabet A to Z and find out: Vertical lines of symmetry.
View SolutionIf the paper is folded three times how many lines of symmetry can be formed with paper cutting.
View SolutionWrite any five man made things which have two lines of symmetry.
View SolutionSolve the equation 6p=24 by trial and Error method.
View SolutionWhat is the shape of the face of a cube?
View SolutionHow many lines of symmetry does the above figure have ?
View SolutionDetermine the point of symmetry of a regular hexagon.
View SolutionComplete adjectant figure so that X-axis and Y-axis are the lines of symmetry of the completed figure.
View SolutionDtermine the images of the following figure about the given line :
View SolutionMatch the following Column A to Column B

View SolutionFind the area of figure given below.

View SolutionFind the perimeter of the figure given below.

View SolutionFind the area of the figure given below.

View SolutionThe area of the shaded part in the figure given below is ______.

View Solution
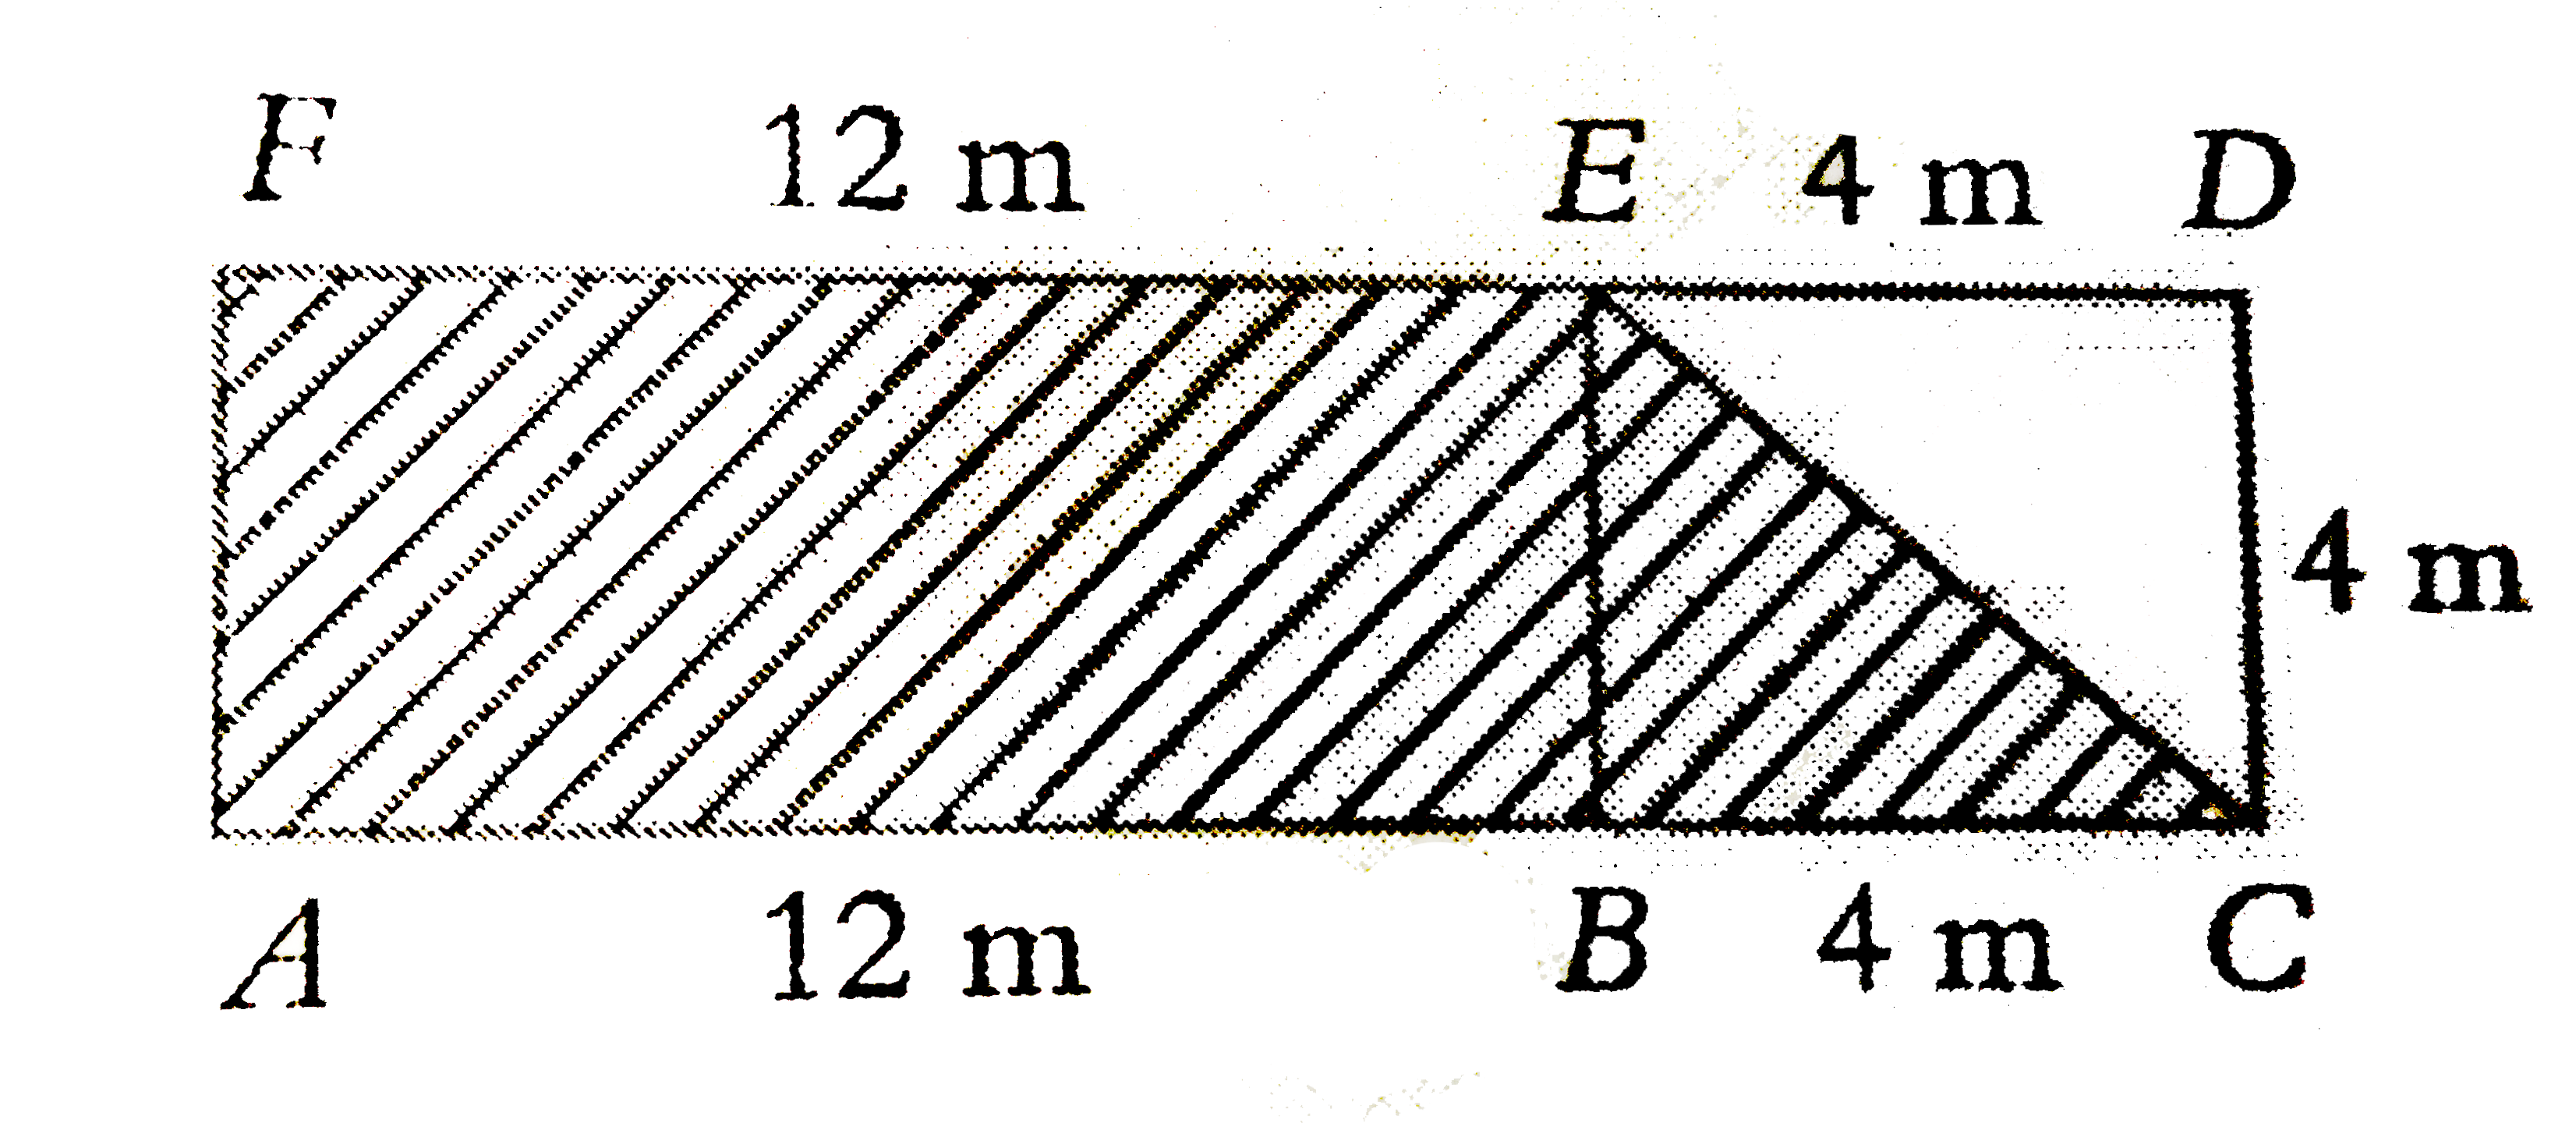
Find the area of the shaded part in the figure given above.
View SolutionThe inequation represented by the graph given below is :
View Solution
