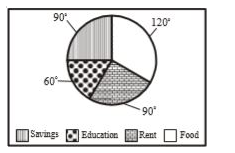
The adjoining pie chart gives the expenditure on various items during a month for a family. (The numbers written around the pie chart tell us the angles made by each sector at the centre.)
Answer the following-

On which item is the expenditure maximum? Solution in Telugu
The correct Answer is:Food
Step by step video & image solution for The adjoining pie chart gives the expenditure on various items during a month for a family. (The numbers written around the pie chart tell us the angles made by each sector at the centre.) Answer the following- On which item is the expenditure maximum? by Maths experts to help you in doubts & scoring excellent marks in Class 7 exams.
Updated on:21/07/2023Topper's Solved these Questions
Similar Questions
Say true or false and why? The difference between the largest and smallest observations in a data set is called the mean.
View SolutionConstruct △ ABC in which AB = 4.5 cm, AC = 4.5 cm and ∠B=50∘. Check whether you get two triangles.
View SolutionExpress the number appearing in the following statements in standard form. The distance between the Earth and the Moon is approximately 384,000,000m.
View SolutionInstructions: The attached pie chart shows the expenditure and its savings (in percentage) in various items of the family throughout the month. Answer the following questions based on the pie chart.
View SolutionThe adjoining pie chart gives the expenditure on various Items during a month for a family. (The numbers written around the pie chart tell as the angles made by each sector at the centre). Answer the following : On which Item is the expenditure maximum ?
View SolutionThe adjoining pie chart gives the expenditure on various Items during a month for a family. (The numbers written around the pie chart tell as the angles made by each sector at the centre). Answer the following : If the monthly income of the family is Rs. 9,000 what is the expenditure on rent?
View SolutionThe adjoining pie chart gives the expenditure on various Items during a month for a family. (The numbers written around the pie chart tell as the angles made by each sector at the centre). Answer the following : If the expenditure on food is Rs. 3000 ? What is the expenditure on education of children?
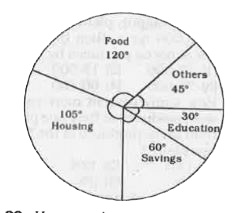
View SolutionThe pie-chart given here shows expenditures incurred by a family on various items and their savings, which amounts to Rs 8,000 in a month.
Study the chart and answer the questions based on the pie-chart

How much expenditure is incurred on education ?
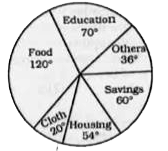
View SolutionDirections : The pie-chart given below shows expenditure incurred by a family on various items and their savings. Study the chart and answer the questions based on the pie-chart

The ratio of expenditure on food to saving is :
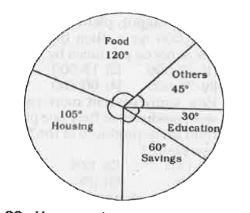
View SolutionThe pie-chart given here shows expenditures incurred by a family on various items and their savings, which amounts to Rs 8,000 in a month.
Study the chart and answer the questions based on the pie-chart

What is the total expenditure of the family for the month ?
View SolutionStudy the chart and answer the question based, on the pie chart. The pie chart given below shows expenditures incurred by a family on various items and savings in a month. Savings of the family is ₹ 8,000 in a month. What is the total expenditure of the family for the month ?
View SolutionStudy the chart and answer the question based, on the pie chart. The pie chart given below shows expenditures incurred by a family on various items and savings in a month. Savings of the family is ₹ 8,000 in a month. The ratio of the expenditure on food to the saving is :
View SolutionStudy the given pie chart carefully and answer the question based on it. Below pie chart given the expenditure (in percentage) on various items and savings of a family during a month. Expenditure on which item is equal to the total savings of the family?
View SolutionStudy the given pie chart carefully and answer the question based on it. Pie chart show below gives the expenditure (in percentage) on various items and savings of a family during a month. On which item, the expenditure was minimum ?
View SolutionStudy the given pie chart carefully and answer the question based on it. Pie chart show below gives the expenditure (in percentage) on various items and savings of a family during a month. Expenditure on which item is equal to the total savings of the family ?
View Solution

