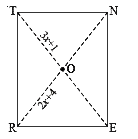
RENT is a rectangle. Its diagonals intersect at O. Find x, if OR = 2x + 4 and OT = 3x +1.
 Solution in Telugu
The correct Answer is:x=3
Step by step video & image solution for RENT is a rectangle. Its diagonals intersect at O. Find x, if OR = 2x + 4 and OT = 3x +1. by Maths experts to help you in doubts & scoring excellent marks in Class 7 exams.
Updated on:21/07/2023Topper's Solved these Questions
- QUADRILATERALSBOOK - NCERT TELUGUCHAPTER - QUADRILATERALSEXERCISE - EXERCISE-1
7 Videos
- QUADRILATERALSBOOK - NCERT TELUGUCHAPTER - QUADRILATERALSEXERCISE - EXERCISE-2
20 Videos
- QUADRILATERALSBOOK - NCERT TELUGUCHAPTER - QUADRILATERALSEXERCISE - EXERCISE - 2 ( FILL IN THE BLANKS)
9 Videos
- POWERS AND EXPONENTSBOOK - NCERT TELUGUCHAPTER - POWERS AND EXPONENTSEXERCISE - DO THIS
56 Videos
- RATIO - APPLICATIONSBOOK - NCERT TELUGUCHAPTER - RATIO - APPLICATIONSEXERCISE - Exercise 6
10 Videos
Similar Questions
in quadrilateral PQRS. i) name the sides, angles, vertices and diagonals. ii) also name the pairs of adjacent angles, opposite sides and opposite angles.

View SolutionState whether true or false: All the rectangles are squares (T/F)
View SolutionA parallelogram in which two adjacent sides are
equal is a ……….
View SolutionWrite the following in exponential form. (values are rounded off)
Total surface area of the Earth is 510,000,000 square kilometers.
View SolutionHow long will it take for a sum of ₹12600 invested at 9% per annum become to ₹15624?
View SolutionDetermine the point of symmetry of a regular hexagon.
View SolutionMatch the following Column A to Column B

View SolutionMatch the following Column A to Column B

View SolutionMatch the following Column A to Column B

View SolutionFind the area of figure given below.

View SolutionFind the perimeter of the figure given below.

View SolutionFind the area of the figure given below.

View SolutionThe inequation represented by the graph given below is :
View SolutionThe inequation that best describes the graph given below is _________
View SolutionThe inequation that best describes the following graph is _________
View SolutionIn Fig, find the value of x.
ltimg src="https://d10lpgp6xz60nq.cloudfront.net/physics_images/PS_MATH_IX_C12_S01_032_Q01.png" width="80%"gt
View Solution
