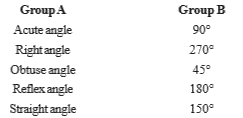
Match the angles by measure. Draw figures for these as well.
 Solution in Telugu
The correct Answer is:Acute angle, 45∘
Right angle, 90∘
Obtuse angle, 150∘
Reflex angle, 270∘
Straight angle, 180∘
Step by step video, text & image solution for Match the angles by measure. Draw figures for these as well. by Maths experts to help you in doubts & scoring excellent marks in Class 6 exams.
Updated on:21/07/2023Topper's Solved these Questions
- MEASURES OF LINES AND ANGLESBOOK - NCERT TELUGUCHAPTER - MEASURES OF LINES AND ANGLESEXERCISE - EXERCISE - 5.3
9 Videos
- MEASURES OF LINES AND ANGLESBOOK - NCERT TELUGUCHAPTER - MEASURES OF LINES AND ANGLESEXERCISE - EXERCISE - 5.2 (True or False)
5 Videos
- KNOWING OUR NUMBERSBOOK - NCERT TELUGUCHAPTER - KNOWING OUR NUMBERSEXERCISE - EXERCISE - 1.5
9 Videos
- PERIMETER AND AREABOOK - NCERT TELUGUCHAPTER - PERIMETER AND AREAEXERCISE - EXERCISE
84 Videos
Similar Questions
Which of the following are models for parallel lines, perpendicular lines and which are neither of them.
The vertical window bars
View SolutionAn angle smaller than right angle is acute angle. State True or false
View SolutionThe number of people who visited games village during commonwealth games in new Delhi for the first four days was recorded as 15,290,15,181, 14,235 and 10,578. Find the total number of people visited in these four days?
View SolutionFind the perimeter : A table with sides equal to 30cm, 15cm, 30cm, and 15cm respectively.
View SolutionMatch the following lists:

View SolutionHow many lines of symmetry does the above figure have ?
View SolutionDetermine the point of symmetry of a regular hexagon.
View SolutionDtermine the images of the following figure about the given line :
View SolutionDraw the bisector of ∠AOB=58∘
ltimg src="https://d10lpgp6xz60nq.cloudfront.net/physics_images/PS_MATH_VII_C05_S01_009_Q01.png" width="80%"gt
View SolutionMatch the following Column A to Column B

View SolutionMatch the following Column A to Column B

View SolutionMatch the following Column A to Column B

View SolutionFind the area of the figure given below.

View SolutionThe inequation represented by the graph given below is :
View SolutionThe inequation that best describes the graph given below is _________
View SolutionThe inequation that best describes the following graph is _________
View Solution
