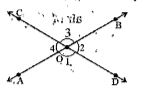
Draw two lines ¯¯¯¯¯¯AB and ¯¯¯¯¯¯CD such that they intersect at point 'O' .Trace the figure given below on a tracing papier. Place the traced figure over the figure given below and rotate it such that ∠DOB coincides ∠COA,Observe the angles ∠AOD and ∠BOC also ∠COA and ∠DOB.You will notice that ∠AOD=∠BOC and ∠CDA=∠DOB Solution in Telugu
Step by step video solution for Draw two lines bar(AB) and bar(CD) such that they intersect at point 'O' .Trace the figure given below on a tracing papier. Place the traced figure over the figure given below and rotate it such that /_DOB coincides /_COA,Observe the angles /_AOD and /_BOC also /_COA and /_DOB.You will notice that /_AOD=/_BOC and /_CDA=/_DOB by Maths experts to help you in doubts & scoring excellent marks in Class 7 exams.
Updated on:21/07/2023Topper's Solved these Questions
Similar Questions
Draw 0r write five pairs of complementary angles of your choice.
View SolutionSome integers are marked on the number line which is the biggest and which is the smallest?
View SolutionWrite the following in exponential form. (values are rounded off)
Total surface area of the Earth is 510,000,000 square kilometers.
View SolutionIn the given figure (not to scale), O is the centre of the circle. A,B,C and D are concyclic and AB=CD . If /_MON =120^(@) , then find /_ OPN .
View SolutionHow many lines of symmetry does the above figure have ?
View SolutionIn the figure given below, bar(ED)||bar(AB) and bar(EF)||bar(BC) . If /_FED =40^(@) and /_ DEC =20^(@) , then the angle made by bar(BC) at the centre is
View SolutionDtermine the images of the following figure about the given line :
View SolutionIn the figure above (not to scale), ¯¯¯¯¯¯AB⊥¯¯¯¯¯¯CDandAD is the bisector of ∠BAE.AB=3cm and AC=5cm. Find CD.
View SolutionIn the given figure, AB is a diameter, O is the center of the circle and ∠OCB=50∘ then find ∠DBC.
View SolutionMatch the following Column A to Column B

View SolutionFind the area of figure given below.

View SolutionFind the perimeter of the figure given below.

View SolutionFind the area of the figure given below.

View SolutionThe area of the shaded part in the figure given below is ______.

View SolutionThe inequation represented by the graph given below is :
View SolutionThe inequation that best describes the graph given below is _________
View Solution
