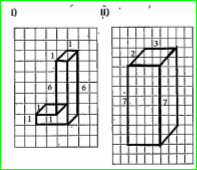
use an isometric dot paper and make an isometric sketch for one of the given shapes. Solution in Telugu
Step by step video & image solution for use an isometric dot paper and make an isometric sketch for one of the given shapes. by Maths experts to help you in doubts & scoring excellent marks in Class 7 exams.
Updated on:21/07/2023Topper's Solved these Questions
- UNDERSTAND 3D AND 2D SHAPESBOOK - NCERT TELUGUCHAPTER - UNDERSTAND 3D AND 2D SHAPESEXERCISE - Exerciese -4
5 Videos
- UNDERSTAND 3D AND 2D SHAPESBOOK - NCERT TELUGUCHAPTER - UNDERSTAND 3D AND 2D SHAPESEXERCISE - Exerciese -2
4 Videos
- TRIANGLE AND ITS PROPERTIESBOOK - NCERT TELUGUCHAPTER - TRIANGLE AND ITS PROPERTIESEXERCISE - EXERCISE - 1
4 Videos
- UNDERSTANDING 3D AND 2D SHAPESBOOK - NCERT TELUGUCHAPTER - UNDERSTANDING 3D AND 2D SHAPESEXERCISE - Do This
5 Videos
Similar Questions
a bulb is kept burning just right above the following solids. Name the shape of the shadows obtained in each case. Attempt to give a rough sketch of the shadow.

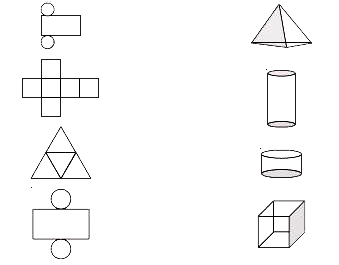
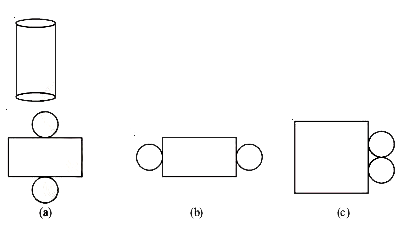
View SolutionThree nets for each shape are given here. Match the net with its 3-D shape.
3D shapes


View SolutionIs it possible to have a triangle with the following sides?
3 cm, 4 cm and 6 cm.
View SolutionWhat cross-sections do you get when you give a (i) vertical cut (ii) horizontal cut to the following solids?
A brick
View SolutionDetermine the point of symmetry of a regular hexagon.
View SolutionDtermine the images of the following figure about the given line :
View SolutionMatch the following Column A to Column B

View SolutionMatch the following Column A to Column B

View SolutionMatch the following Column A to Column B

View SolutionFind the area of the figure given below.

View SolutionCalculate the volume of the given solid.
ltimg src="https://d10lpgp6xz60nq.cloudfront.net/physics_images/PS_MATH_VII_C06_E03_002_Q01.png" width="80%"gt
View SolutionThe area of the shaded part in the figure given below is ______.

View SolutionThe inequation represented by the graph given below is :
View SolutionThe inequation that best describes the graph given below is _________
View SolutionThe inequation that best describes the following graph is _________
View SolutionWhich inequations represent the shaded region in the given figure
View Solution
