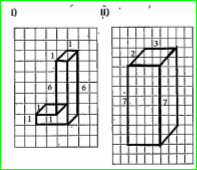
here are some shadows of some 3D objects, when seen under the lamp of an overhead projector. Identify the solids that match each shadows.
 Solution in Telugu
The correct Answer is:Triangular shapes or Right prism with triangular base.
Step by step video, text & image solution for here are some shadows of some 3D objects, when seen under the lamp of an overhead projector. Identify the solids that match each shadows. by Maths experts to help you in doubts & scoring excellent marks in Class 7 exams.
Updated on:21/07/2023Topper's Solved these Questions
- UNDERSTAND 3D AND 2D SHAPESBOOK - NCERT TELUGUCHAPTER - UNDERSTAND 3D AND 2D SHAPESEXERCISE - Exerciese -3
9 Videos
- TRIANGLE AND ITS PROPERTIESBOOK - NCERT TELUGUCHAPTER - TRIANGLE AND ITS PROPERTIESEXERCISE - EXERCISE - 1
4 Videos
- UNDERSTANDING 3D AND 2D SHAPESBOOK - NCERT TELUGUCHAPTER - UNDERSTANDING 3D AND 2D SHAPESEXERCISE - Do This
5 Videos
Similar Questions
use an isometric dot paper and make an isometric sketch for one of the given shapes.

View SolutionIs it possible to have a triangle with the following sides?
3 cm, 4 cm and 6 cm.
View SolutionWhat cross-sections do you get when you give a (i) vertical cut (ii) horizontal cut to the following solids?
A brick
View SolutionIdentify the cell organelle 'A' :-
ltimg src="https://d10lpgp6xz60nq.cloudfront.net/physics_images/ALN_BIO_C10_E08_018_Q01.png" width="80%"gt
View SolutionHow many lines of symmetry does the above figure have ?
View SolutionWhich of the following are correct chain isomers of butane ? (i)
View SolutionDetermine the point of symmetry of a regular hexagon.
View SolutionDtermine the images of the following figure about the given line :
View SolutionMatch the following Column A to Column B

View SolutionMatch the following Column A to Column B

View SolutionMatch the following Column A to Column B

View SolutionCalculate the volume of the given solid.
ltimg src="https://d10lpgp6xz60nq.cloudfront.net/physics_images/PS_MATH_VII_C06_E03_002_Q01.png" width="80%"gt
View SolutionThe inequation represented by the graph given below is :
View SolutionThe inequation that best describes the graph given below is _________
View SolutionThe inequation that best describes the following graph is _________
View SolutionWhich inequations represent the shaded region in the given figure
View Solution
