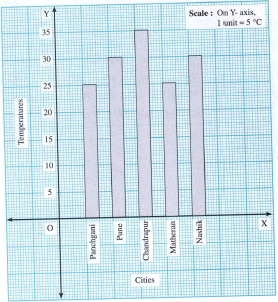
This bar graph shows the temperatures in degree Celsius in different cities on a certain day in February. Observe the graph and answer the questions :
What data is shown on the vertical and the horizontal lines ?
8.4sqcm
16.8sqcm
25.2sqcm
37.8sqcm45
Step by step video & image solution for This bar graph shows the temperatures in degree Celsius in different cities on a certain day in February. Observe the graph and answer the questions : What data is shown on the vertical and the horizontal lines ? by Maths experts to help you in doubts & scoring excellent marks in Class 10 exams.
Updated on:21/07/2023Topper's Solved these Questions
- SAMPLE PAPER - 11BOOK - EDUCART PUBLICATIONCHAPTER - SAMPLE PAPER - 11EXERCISE - SECTION-B
17 Videos
- SAMPLE PAPER (SELF ASSESSMENT) 12BOOK - EDUCART PUBLICATIONCHAPTER - SAMPLE PAPER (SELF ASSESSMENT) 12EXERCISE - PART-B (Section-V)
4 Videos
- SAMPLE PAPER - 3BOOK - EDUCART PUBLICATIONCHAPTER - SAMPLE PAPER - 3EXERCISE - SECTION-C
10 Videos
Similar Questions
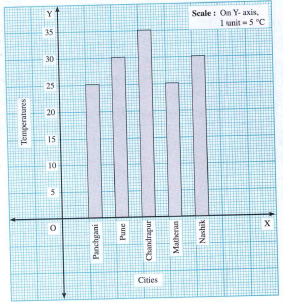
This bar graph shows the temperatures in degree Celsius in different cities on a certain day in February. Observe the graph and answer the questions :
Which city had the highest temperature ?
View SolutionThis bar graph shows the temperatures in degree Celsius in different cities on a certain day in February. Observe the graph and answer the questions :
Which cities had equal maximum temperatures ?
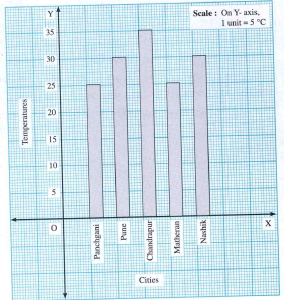
View SolutionThis bar graph shows the temperatures in degree Celsius in different cities on a certain day in February. Observe the graph and answer the questions :
Which cities had a maximum temperature of 30∘C ?
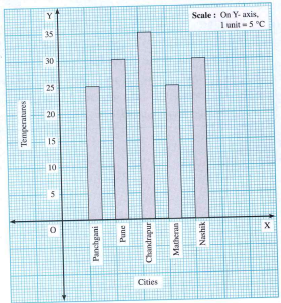
View SolutionThis bar graph shows the temperatures in degree Celsius in different cities on a certain day in February. Observe the graph and answer the questions :
What is the difference between the maximum temperatures of Panchgani and Chandrapur ?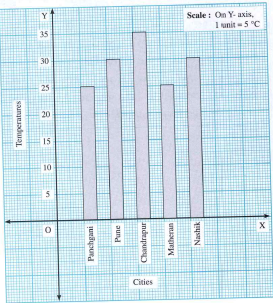
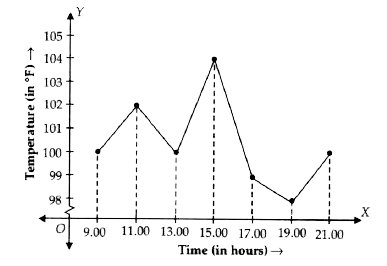
View SolutionObserve the graph and answer the following questions.
The temperature is minimum at
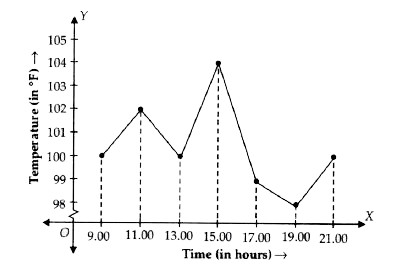
View SolutionObserve the graph and answer the following questions.
The temperature is maximum at
View SolutionRead the graph and answer the following questions
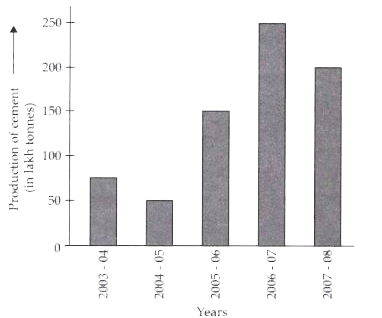
What information is conveyed by the bar graph
View SolutionObserve the graph and answer the following questions.
The temperature of the patient at 11.00 hours is
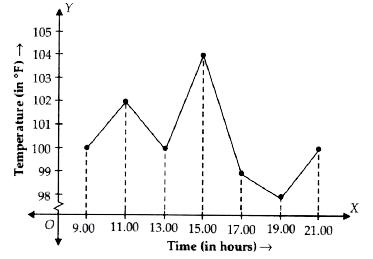
View SolutionObserve the graph and answer the following questions.
The temperature of the patient at 15: 00 hours is
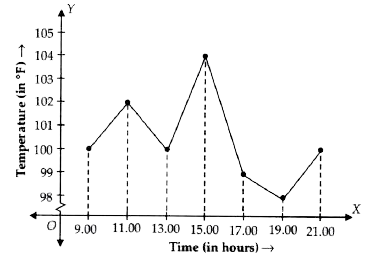
View SolutionThe bar graph shows the temperatures in 6 cities.
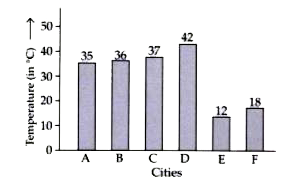
The difference between the maximum and the minimum temperature is ______ .
View Solution
