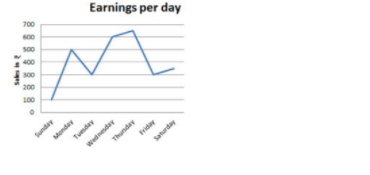
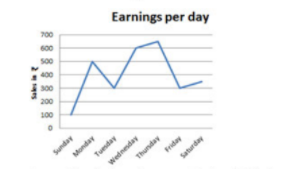
 According to the given graph, the highest earnings was on:
Friday
Wednesday
Thursday
Monday
Step by step video & image solution for According to the given graph, the highest earnings was on: by Reasoning experts to help you in doubts & scoring excellent marks in Class 14 exams.
Similar Questions
Knowledge Check
- Question 1 - Select One
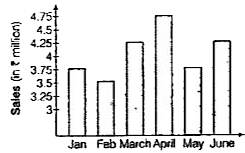
According to the given graph , between which two consecutive months was the changes in the auto sales the greatest ?
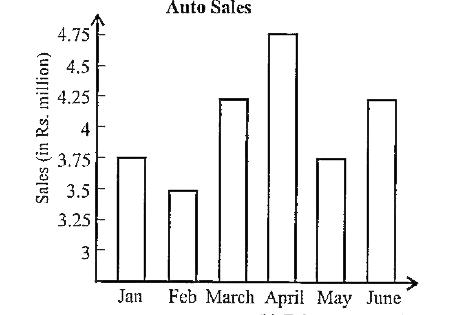 AJanuary-FebruaryBFebruary-MarchCMarch-MayDMay-June
 - Question 2 - Select One
According to the given graph, between which two consecutive months was the change in the auto sales the greatest?
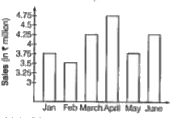 AApril-MayBMay-JuneCJanuary-FebruaryDFebruary-March
 - Question 3 - Select One
The given graph indicates :
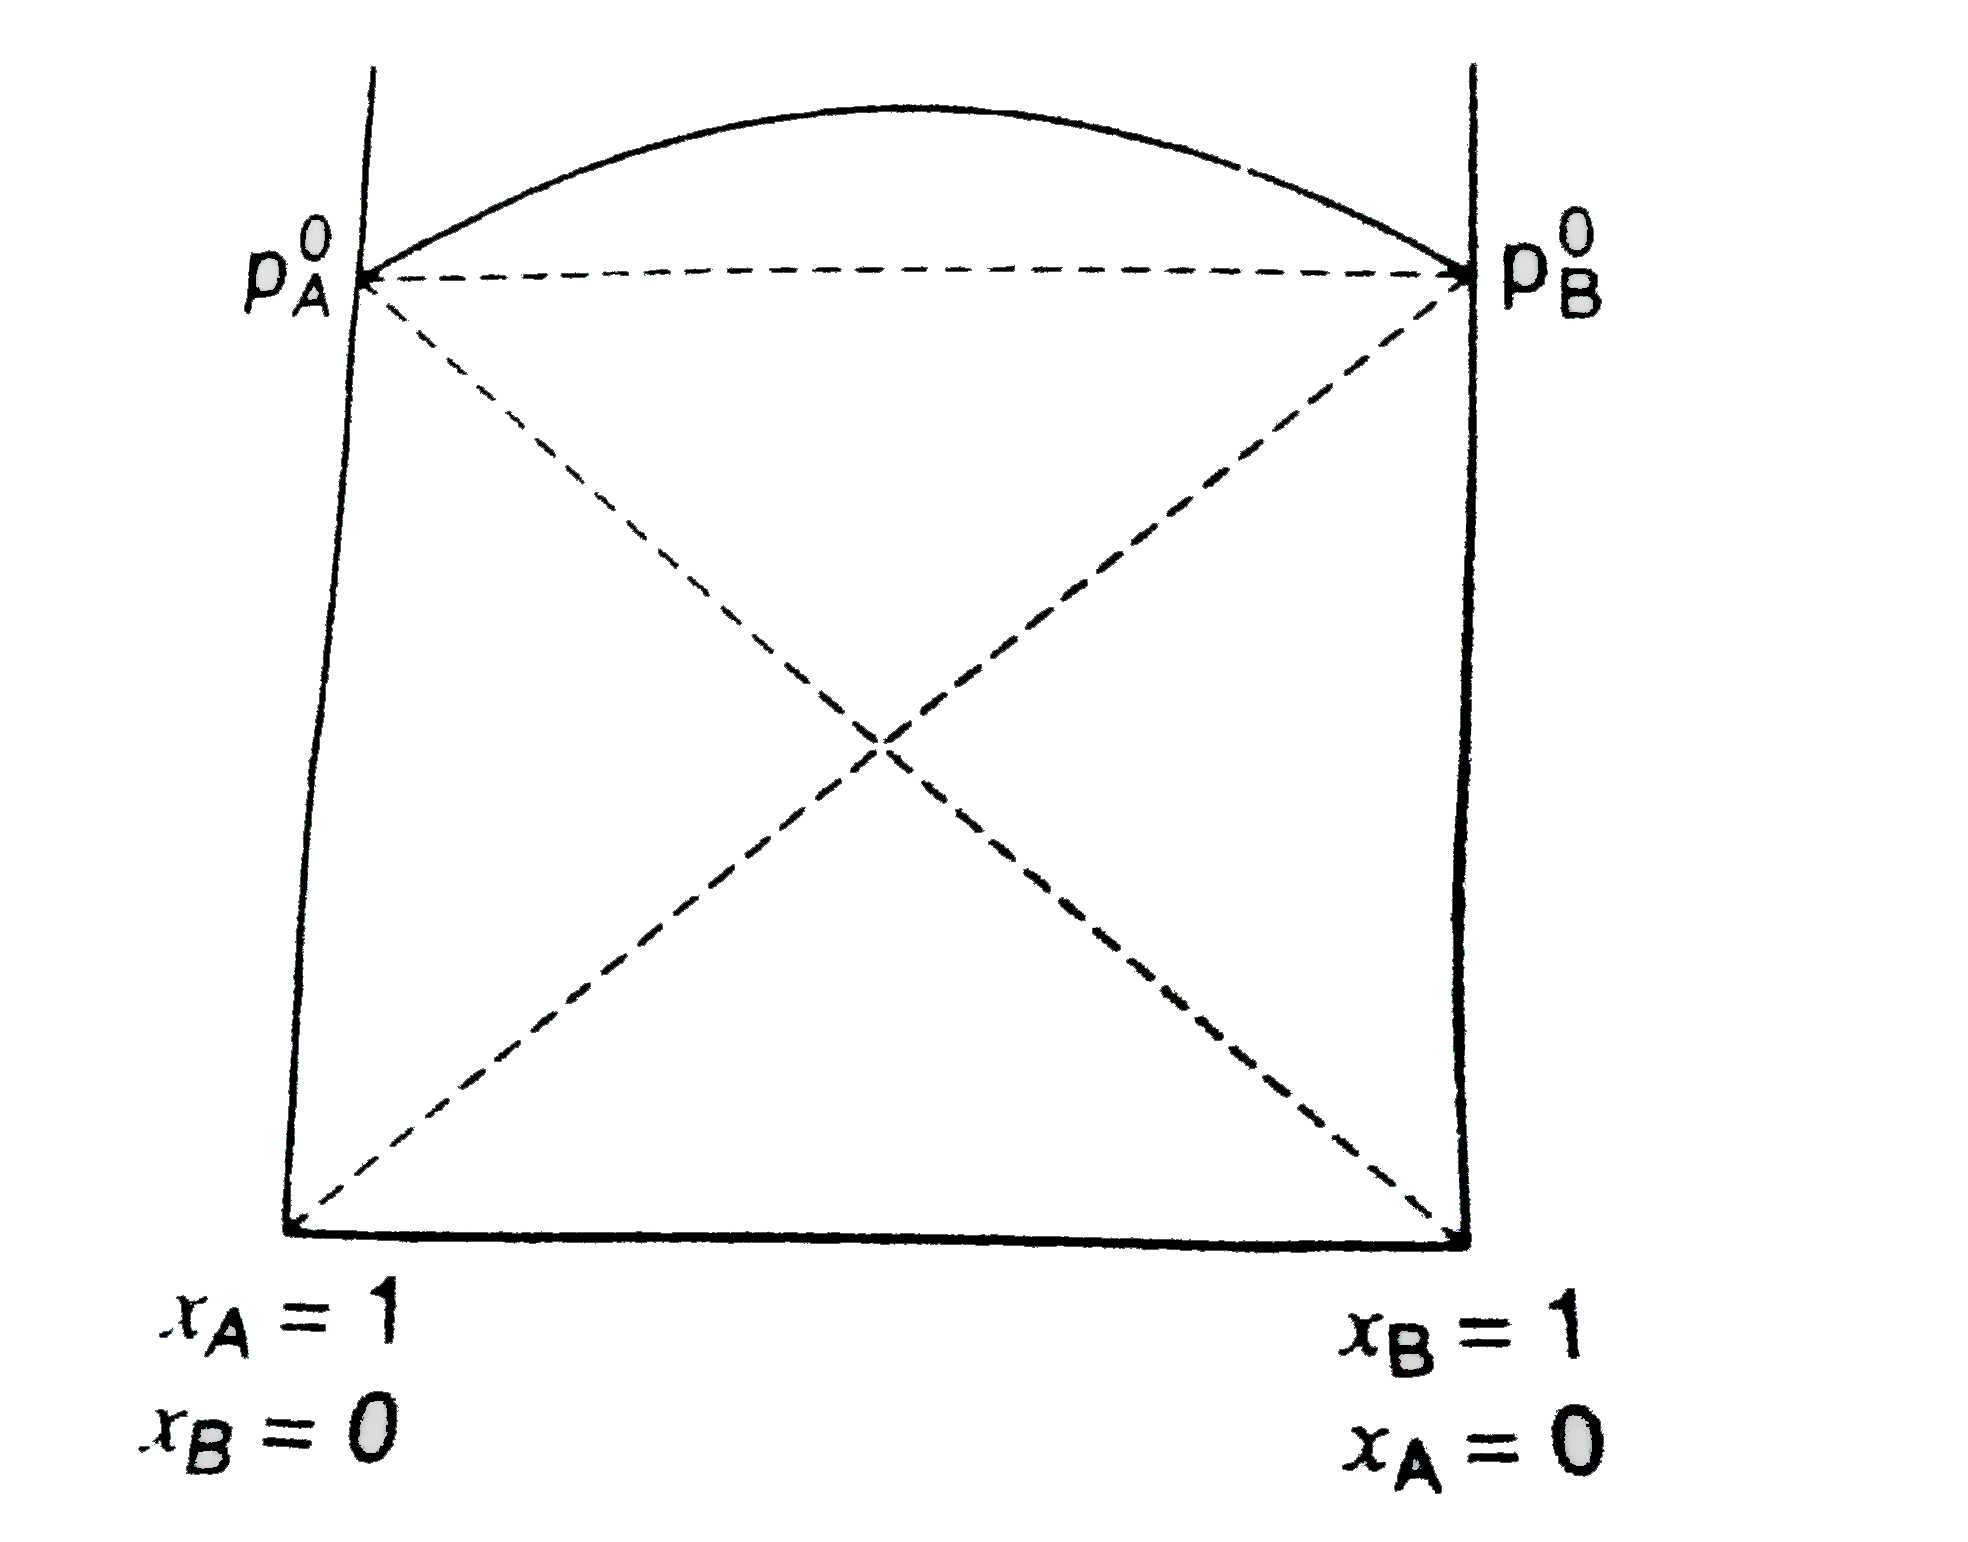 A(+) deviationB(-) deviationCno deviationDnone of these
According to the graph what is the rate of disappearance of the reactant at 10 seconds ?
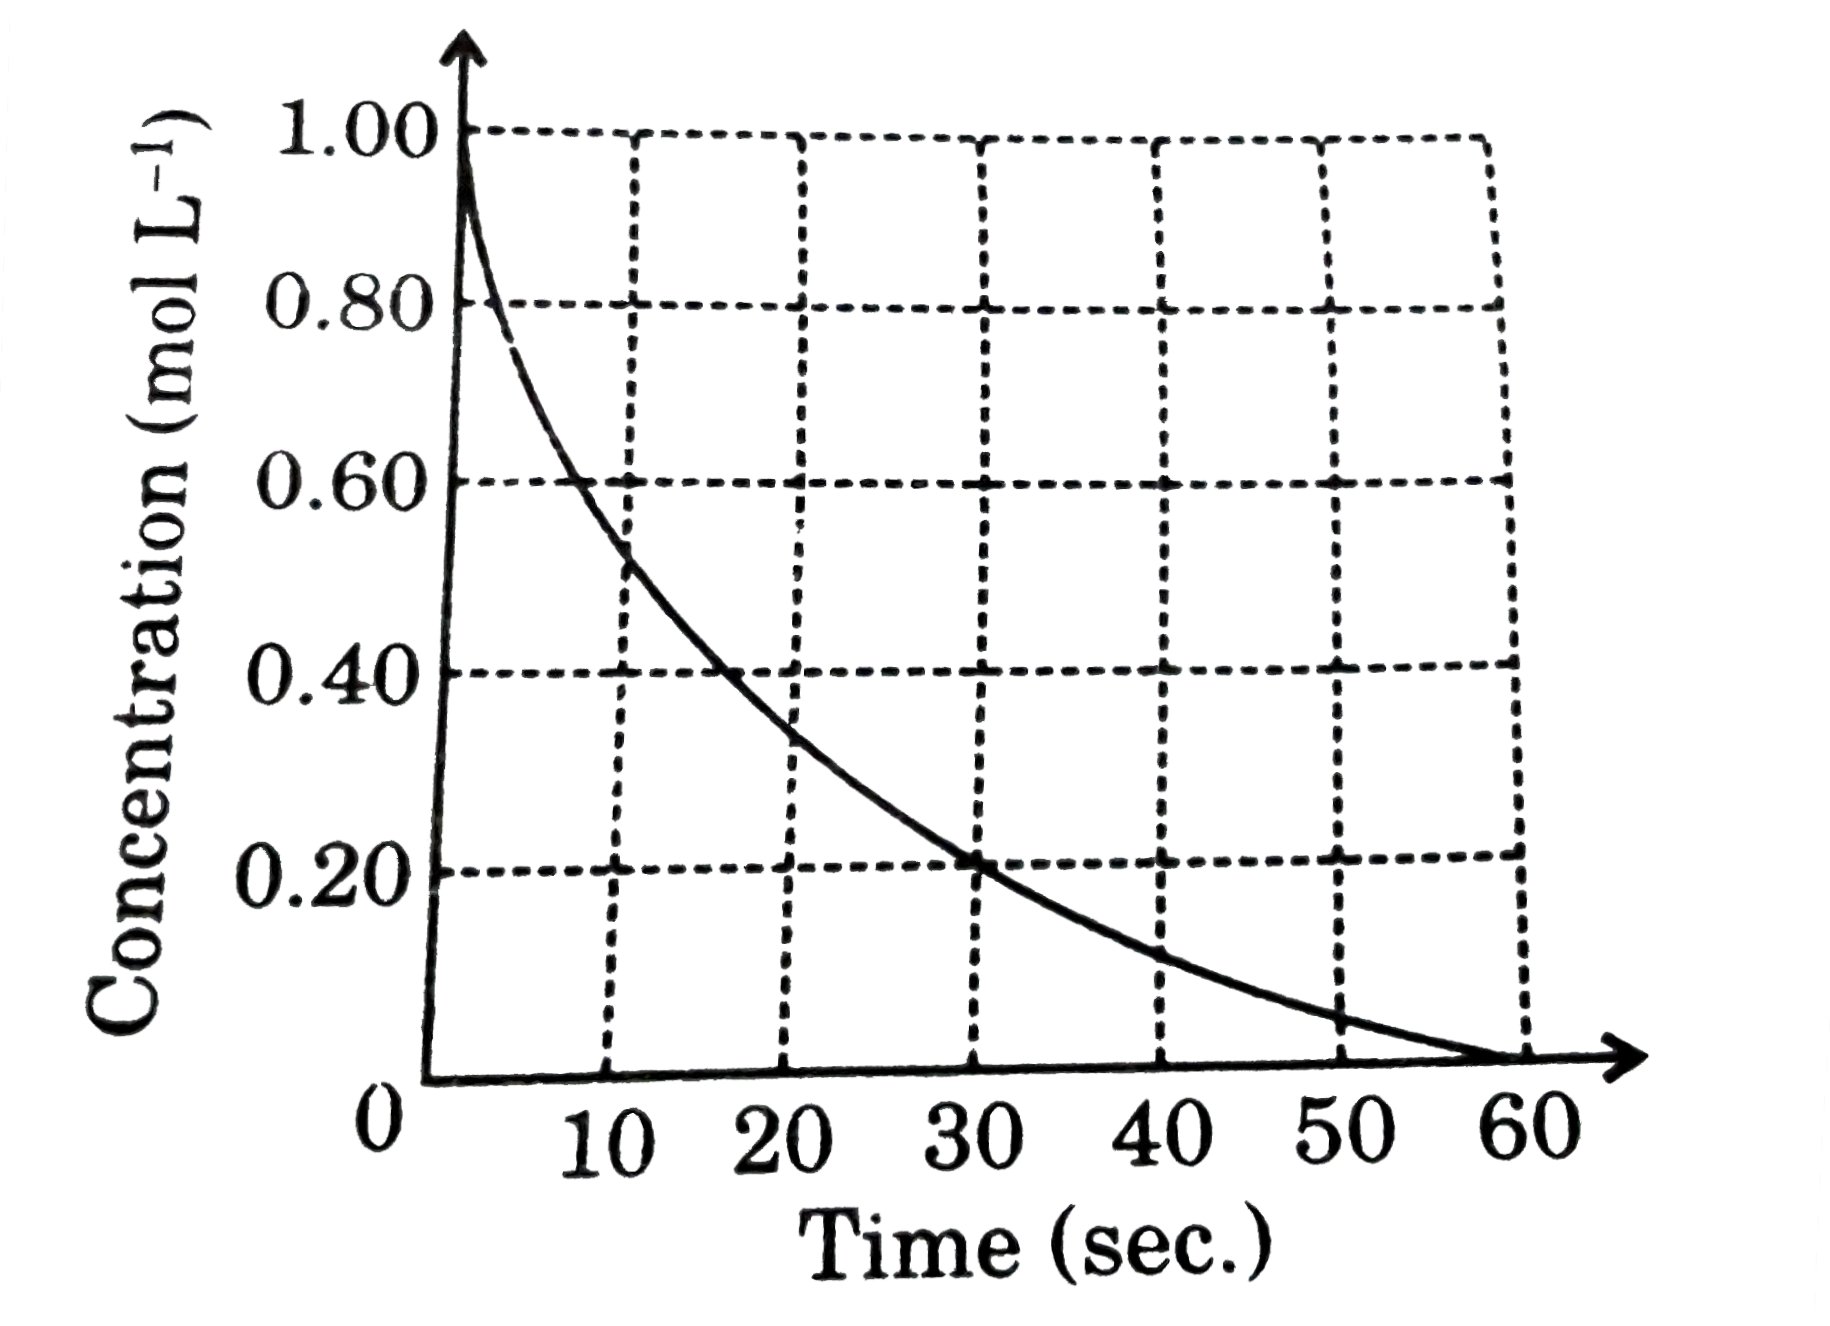 View Solution
The current I in an inductance coil varies with time according to the graph given in the figure.
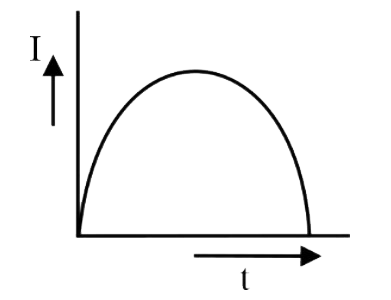
Which one of the following graphs gives the variation of voltage with time across the inductor?View SolutionAccording to Census 2011, which state has the highest density of population?
View SolutionThe potential energy in given according to the following graph.

Which of the following graph represent the force?View SolutionAccording to Moseley, a straight line graph is obtained on plotting:
View Solution

