Direction: The following line graph shows the number of Peoples who are working in certain institute
and speaks four different language. Study the following data and answer the following questions:
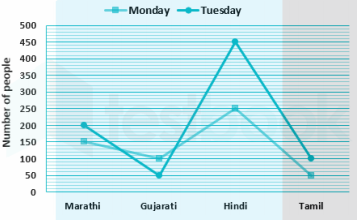
The total number of people who speaks Tamil language on both days is what approximate percent of
the total number of people who speak four different languages on both days?
13
11
8
10
Step by step video & image solution for Direction: The following line graph shows the number of Peoples who are working in certain institute and speaks four different language. Study the following data and answer the following questions:The total number of people who speaks Tamil language on both days is what approximate percent of the total number of people who speak four different languages on both days? by Maths experts to help you in doubts & scoring excellent marks in Class 14 exams.
Similar Questions
Direction: The following line graph shows the number of Peoples who are working in certain institute and speaks four different language. Study the following data and answer the following questions:
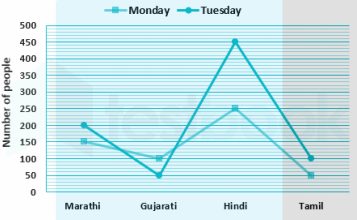
The average number of people who speak four languages on Monday is -View SolutionDirection: The following line graph shows the number of Peoples who are working in certain institute and speaks four different language. Study the following data and answer the following questions:
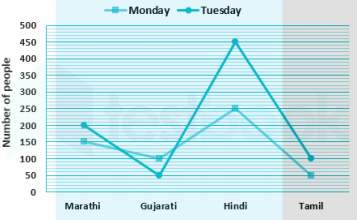
The ratio of the number of people who speaks Marathi language and the number of people who speaks Tamil language on both days - 3 :View Solution
Knowledge Check
- Question 1 - Select One
Find out the number of all those people who can speak Tamil and Telugu?
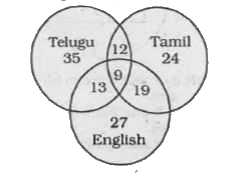 A3B59C21D112
 - Question 2 - Select One
The pie chart shows the results of an online survey which asked people about their favourite author. Study the diagram and answer the following questions.
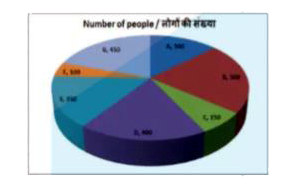
What is the total number of people who have responded to the survey ?A2250B2100C2400D2000 - Question 3 - Select One
The pie chart shows the result of an online survey which asked people about their favourite game. Study the diagram and answer the following questions.
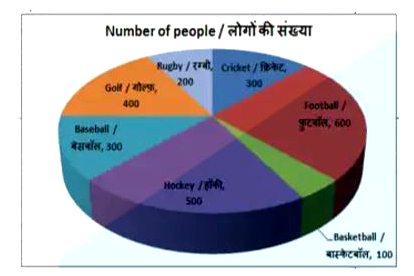
What is the total number of people who have responded to the survey?
(a)2100
(b)2200
(c)2400
(d)2500A2100B2200C2400D2500
Direction: The following line graph shows the number of Peoples who are working in certain institute and speaks four different language. Study the following data and answer the following questions:
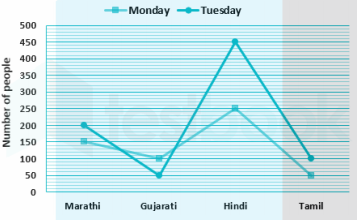
If the ratio of male and female who speaks Hindi language on Monday is 7 : 3, then the number of female who speaks Hindi on Monday is what percent of the total number of people who speaks Hindi on both days?View SolutionDirection: The following line graph shows the number of Peoples who are working in certain institute and speaks four different language. Study the following data and answer the following questions:
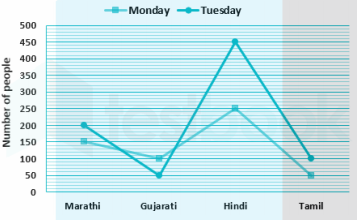
The difference between the number of people who speak Hindi (on Monday and Tuesday) and Gujarati (on Monday and Tuesday) language is -View SolutionDirection: The following table shows the data of people of five different cities. Study the following table and answer the following questions.
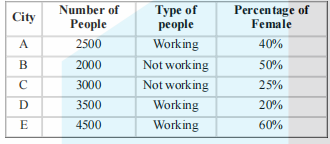
The total number of males who are working out of five cities is-View SolutionDirections: Following table shows, a survey of the number of people who live in their homes and the number of people who live on rent from different villages A, B, C, D and E. Study the following table carefully and give the answer to the following questions.

Find the ratio of the number of people who live in the home to the number of people who live on rent in village A and C combined together.View SolutionThe pie chart shows the results of an online survey which asked people about their favourite game. Study the diagram and answer the following questions.
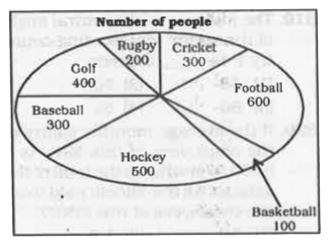
What is the total number of people who have responded to the survey?View Solution

