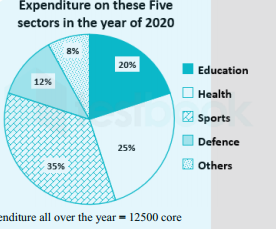
Direction: Study the chart and answer the following questions
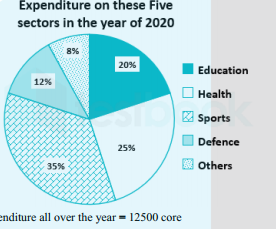
What is the average expenditure spent on different five sector over the year?
2300
2450
2500
3050
Step by step video & image solution for Direction: Study the chart and answer the following questionsWhat is the average expenditure spent on different five sector over the year? by Maths experts to help you in doubts & scoring excellent marks in Class 14 exams.
Updated on:21/07/2023Similar Questions
Direction: Study the chart and answer the following questions

What is the average expenditure spent on different five sector over the year?
View SolutionDirection: Study the chart and answer the following questions
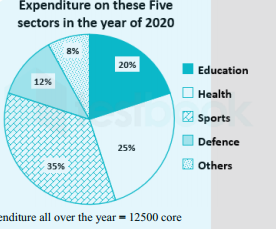
What is the respective ratio between the expenditure of Education, Defence and Sports sectors together and expenditure on Health and Others together?
View Solution
Knowledge Check
The pie chart shows the breakup of expenditure of a mining company for the year 2017. Study the diagram and answer the following questions.
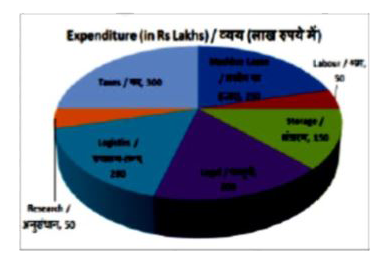
What is the total expenditure (in Rs lakhs)?A1200B900C1000D1100The pie chart shows the breakup of expenditure of a software company for the year 2017. Study the diagram and answer the following questions.
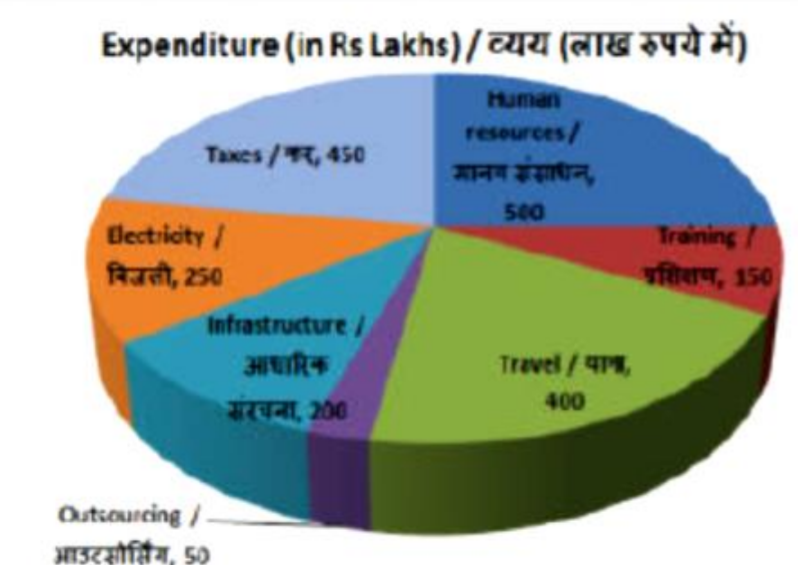
What is the total expenditure (in Rs lakhs)?A2000B1800C2250D2100
Directions : The Piechart shows Distribution of Special Children Population the year 1994-96. Study the pie-chart and answer the following questions
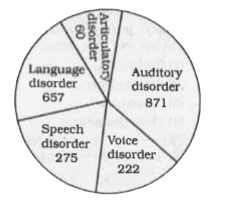
What is the average number of cases in different types of special children during the year 1994-96?
View SolutionDirection: Study the chart and answer the following questions
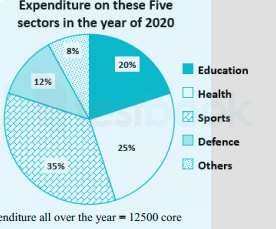
If one-fifth part of the expenditure on sports was spent for building stadiums. What was the total expenditure for building stadium in this year?
View SolutionDirection: Study the chart and answer the following questions
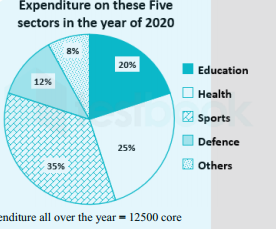
The amount spent on Education Sector is how much percent more / less than the amount of expenditure spent on Others Sector?
View SolutionDirections: Study the Pie chart and answer the following question. The pie chart is showing the percentage of different types of shirts sold by five different stores namely A, B, C, D and E.
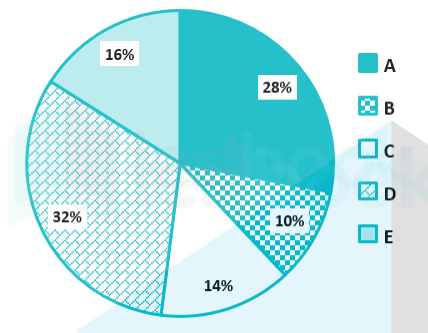
Find the average of shirt sold by all stores. If the shirt sold by store B is 1750.
View SolutionDirections: Study the Pie chart and answer the following question. The pie chart is showing the percentage of different types of shirts sold by five different stores namely A, B, C, D and E.

Find the average of shirt sold by store D and E, if the shirt sold by E is 256
View SolutionDirection: Study the chart and answer the following questions
Expenditure in health sector was how much more than the expenditure on defence sector?
View Solution
