Direction: Read the Graph carefully and answer the following quesitons:
The following Line graph shows the number of Fruits (Apple and Banana) sold in five different
years.
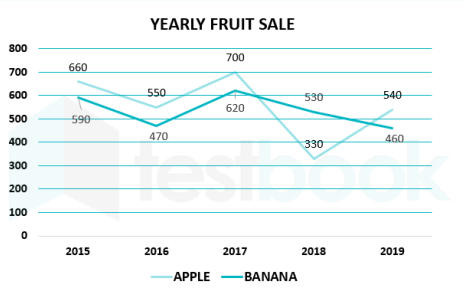
What is the overall average sale of banana?
524
534
538
542
Step by step video & image solution for Direction: Read the Graph carefully and answer the following quesitons: The following Line graph shows the number of Fruits (Apple and Banana) sold in five different years.What is the overall average sale of banana? by Maths experts to help you in doubts & scoring excellent marks in Class 14 exams.
Updated on:21/07/2023Similar Questions
Direction: Read the Graph carefully and answer the following quesitons: The following Line graph shows the number of Fruits (Apple and Banana) sold in five different years.
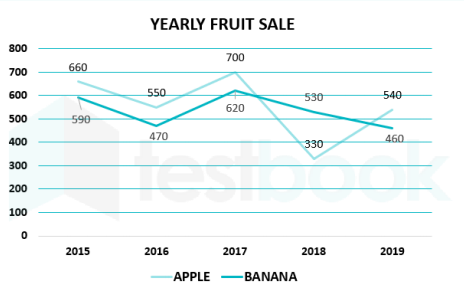
What is the ratio between the sales of apple in 2016 to banana in 2018?
View SolutionDirection: Read the Graph carefully and answer the following quesitons: The following Line graph shows the number of Fruits (Apple and Banana) sold in five different years.
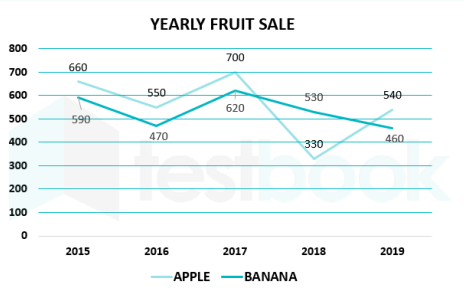
What percent more is the sale of banana to that of apple in 2018?
View Solution
Knowledge Check
Study the graph carefully and answer the following questions.
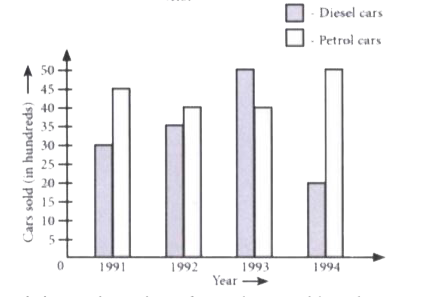
How many cars were sold during the year 1991?A9000B6500C7500D7000
Direction: Read the Graph carefully and answer the following quesitons: The following Line graph shows the number of Fruits (Apple and Banana) sold in five different years.
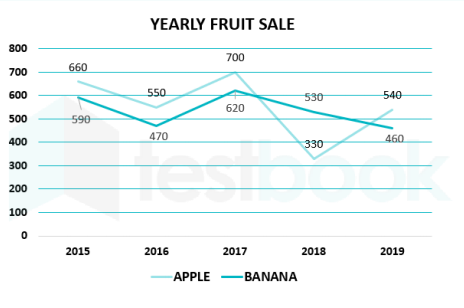
The total number of sale of banana in 2017 is what percent of the total number of sale of apple in 2017?
View SolutionDirection: Read the Graph carefully and answer the following quesitons: The following Line graph shows the number of Fruits (Apple and Banana) sold in five different years.
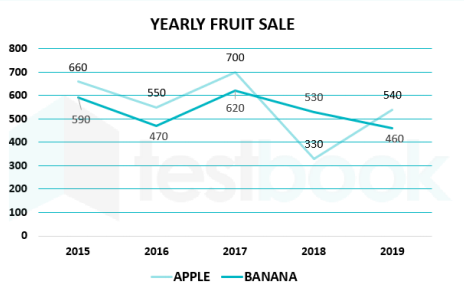
In which year is the difference between the sale of apple and banana recorded the most?
View SolutionDirection: Read the following Bar graph carefully and answer the following questions: The following bar graph shows the number of visitors to the Taj Mahal in the first week of January.
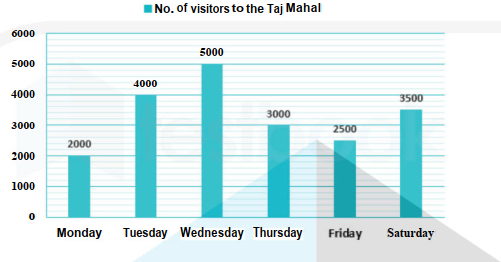
Find the average of all the visitors who visited the Taj Mahal from Mondary to Friday
View SolutionDirection: Read the following Bar graph carefully and answer the following questions: The following bar graph shows the number of visitors to the Taj Mahal in the first week of January.
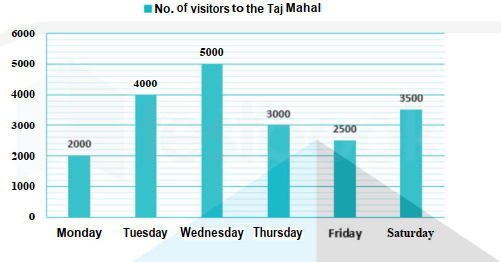
The number of visitors on Saturaday is what percentage more than that of Friday
View SolutionDirection: Read the following Bar graph carefully and answer the following questions: The following bar graph shows the number of visitors to the Taj Mahal in the first week of January.
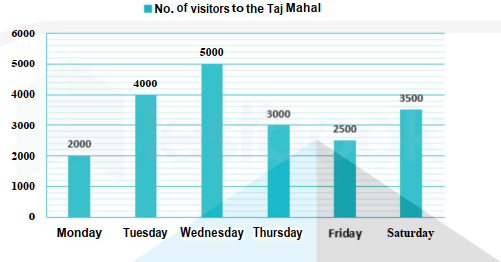
Find the ratio of visitors the Taj Mahal on Monday and Thursady.
View SolutionDirection: Read the following Bar graph carefully and answer the following questions: The following bar graph shows the number of visitors to the Taj Mahal in the first week of January.
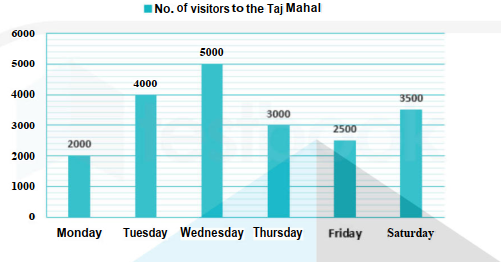
The ratio of male and female visitors on Friday is 3:2. Find the difference between the number of male and female vistors
View SolutionDirection: Read the following Bar graph carefully and answer the following questions: The following bar graph shows the number of visitors to the Taj Mahal in the first week of January.
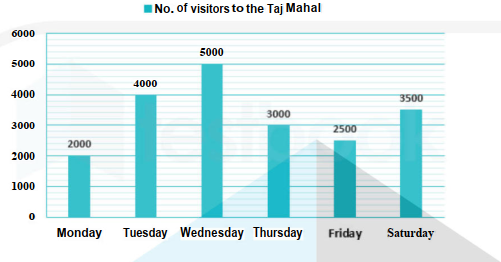
Find on which day the number of vistiros to the Taj Mahal is the highest?
View Solution
