No scholarship or reward _____ given to the student who stood first in the examination.
are
were
was
had
The correct Answer is:C
Similar Questions
Knowledge Check
The ratio of the number of boys and girls in a school is 3:2.If 20% of the boys and 25% of the girls are scholarship holders, then the percentage of the students who do not get the scholarship, is
A78%B75%C60%D55%In a class, Ena ranked eighteen from the top and thirty-ninth from the bottom among those who passed an examination. Ten students did not appear in the examination and four failed. What is the total number of students in the class ?
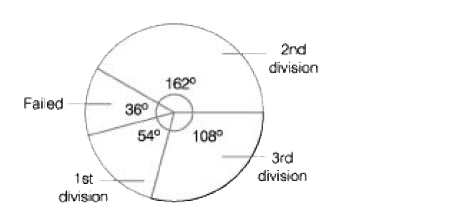
A40B60C56D70The following pie chart shows the performance in an examination in a particular year for 360 students. The percentage of students who have failed in the examination is
 A0.2B0.36C0.1D0.3
Find the error in the given sentence.
This is the man that son stood first.
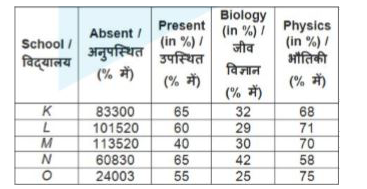
View SolutionThe table given below shows the number of students who were absent and percentage of students who were present in the given two examinations from five different schools. The table also shows the percentage of students who were present in the Biology. And Physics examination respectively.
 What is the average of the number of the students who were present in Physics examination from school N, K and L?
View SolutionThe table given below shows the number of students who were absent and percentage of students who were present in the given two examinations from five different schools. The table also shows the percentage of students who were present in the Biology and Physics examination respectively.

What is the average of the number of the students who were of the students who were present in Physics examination from schools N. K and L?
View SolutionIn an examination, 15% students failed and 425 students passed. Find the number of students who failed in the examination, 15% students failed and 425 students passed. Find the number of students who failed in the examination.
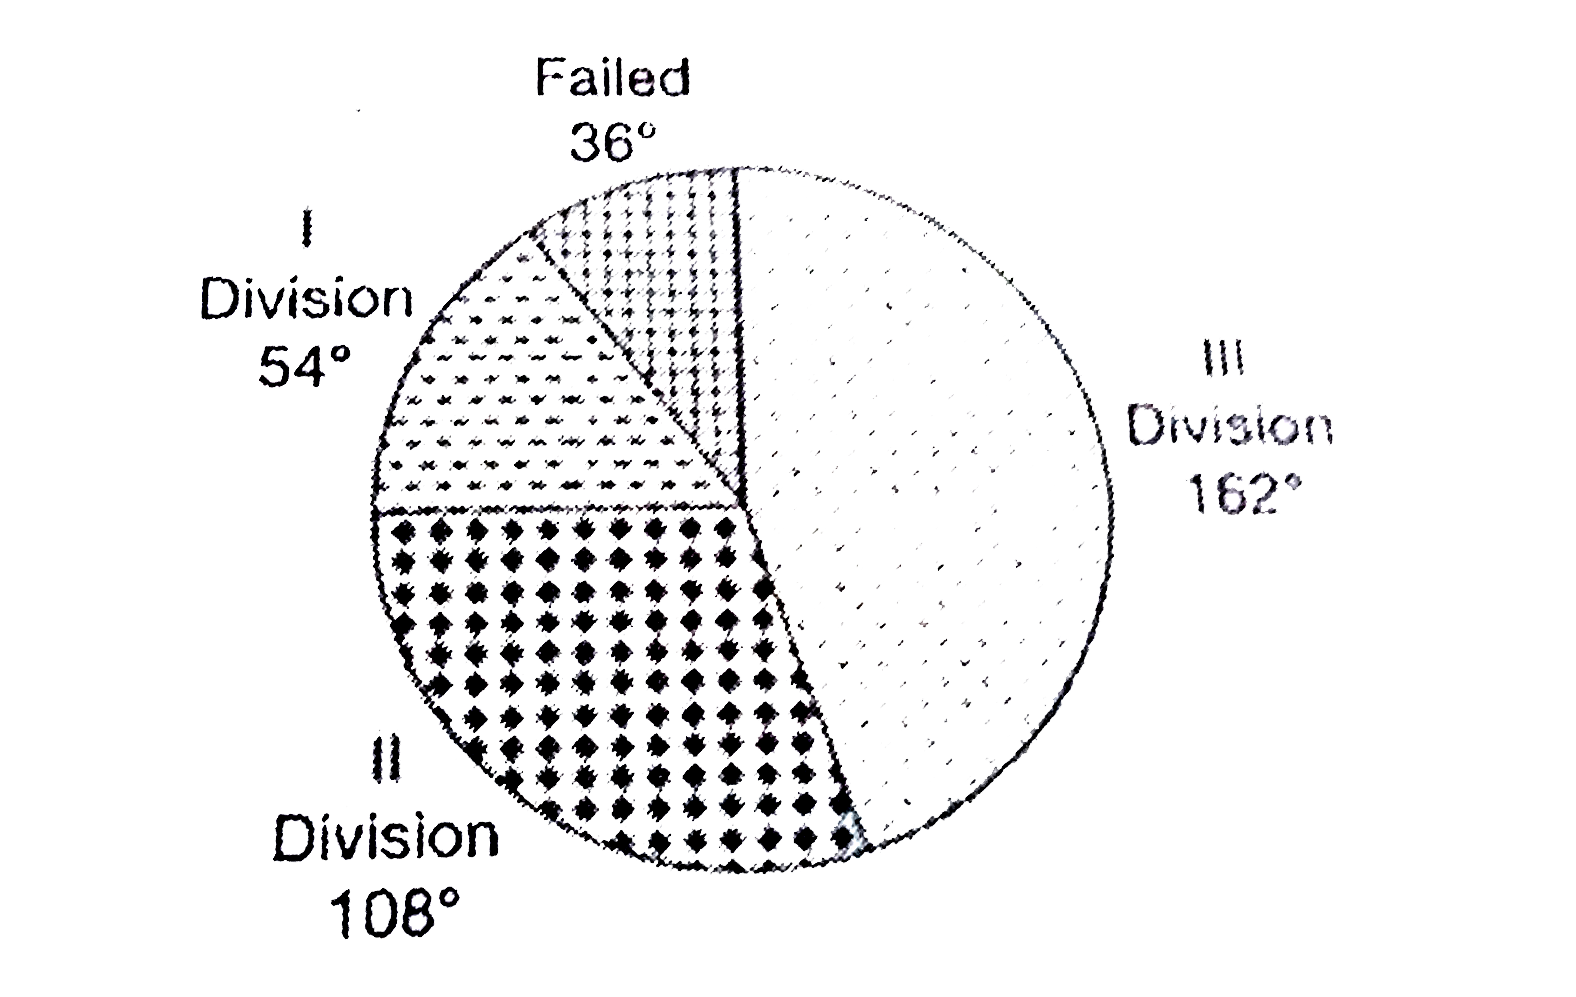
View SolutionThe performance of 720 students in an examination for the academic year 2015-16 is shown in a pie chart. Study the pie chart carefully and answer the questions that follow.

(i) Find the number of students who passed in the first division.
(ii) Find the ratio of number of students who passed to that of failed.
(iii) Find the pecentage of the number of students who failed in the examination.
View Solution
