GDP is the total value of ______ produced during a particular year.
All goods and services
All final goods and services
All intermediate goods and services
All intermediate and final goods and services
The correct Answer is:C
All intermediate goods and services
Similar Questions
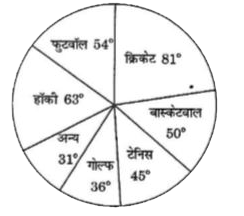
The Pie Charts shows the expenditure of a country on various sports during a particular year. Study the graph and answer the questions:
If the total amount spent on cricket and hockey together is Rs 80,000 then total expenditure on all sports?
View SolutionThe bar graph shows the number of toys produced by a factory during a certain week.
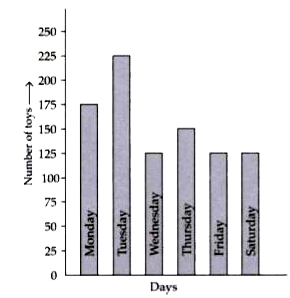
What is the total number of toys produced during the week ?
View Solution
Knowledge Check
Choose the most appropriate option from the following.
GDP is the total value of ________ during a specific periodAall goods and services prodluced or soldBall the finished goods and services produced within a countryCall intermediate goods and services produced or soldDboth intermediate and final goods and serivces produced within a countryGDP is the value of............................ produced during a particular year.
Aall raw materialsBall final goods and servicesCall agricultural productsDNone of theseThe pie chart drawn below shows the spendings of a country on various sports during a particular year. Study the pie chart and answer the questions.
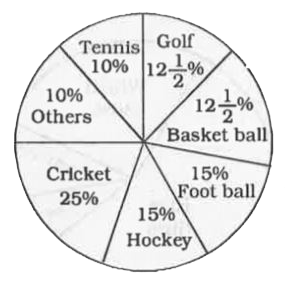
Total central angle showing the money spent on hockey, football and other during the year wasA104∘B244∘C96∘D144∘
The pie chart,drawn, shows the spending of a country on various sports during a particular year. Study the graph carefully and answer the questions that follow.
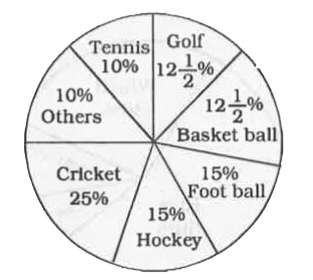
The ratio of the total amount spent on football to that spent on hockey is?
View SolutionThe pie chart,drawn, shows the spending of a country on various sports during a particular year. Study the graph carefully and answer the questions that follow.
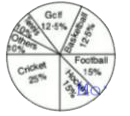
If the total amount spent on sports during the year was Rs 30,00,000 the amount spent on Cricket and Hockey together was
View SolutionThe pie chart given here shows the spendings of a country on various sports during a particular year. Study the graph carefully and answer the questions given below it.
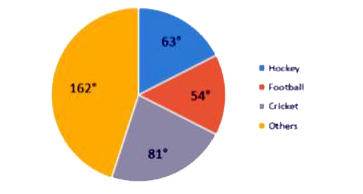
If the total amount spent on sports during the year be ₹18000, the amount spent on Cricket exceeds that on football by (in ₹):
View SolutionThe pie chart drawn below shows the spendings of a country on various sports during a particular year. Study the pie chart and answer the questions.
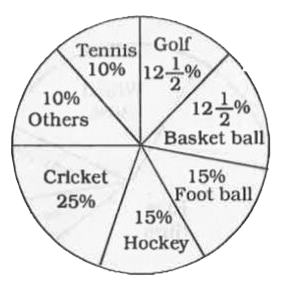
If, the total amount spent on sports during the year was Rs. 1,20,00,000, how much was spent on basketball ?
View SolutionThe pie chart given here shows the spendings of a country on various sports during a particular year. Study the chart carefully and answer the questions given below:
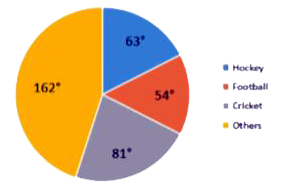
What percent of the total spendings is spent on others?
View Solution
