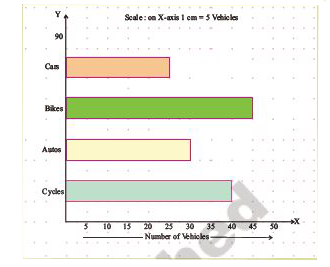
Represent the data in the adjacent bar graph as frequency distribution table.
 Solution in Telugu
The correct Answer is:Type of Vehicles Car Bikes Autos Cycles
No. of Vehicles (f) 25 45 30 40
Step by step video, text & image solution for Represent the data in the adjacent bar graph as frequency distribution table. by Maths experts to help you in doubts & scoring excellent marks in Class 9 exams.
Updated on:21/07/2023Topper's Solved these Questions
- STATISTICSBOOK - NCERT TELUGUCHAPTER - STATISTICSEXERCISE - EXERCISE-9.2
11 Videos
- STATISTICSBOOK - NCERT TELUGUCHAPTER - STATISTICSEXERCISE - THINK DISCUSS AND WRITE
3 Videos
- REAL NUMBERSBOOK - NCERT TELUGUCHAPTER - REAL NUMBERSEXERCISE - Exercise 1.4
11 Videos
- SURFACE AREAS AND VOLUMES BOOK - NCERT TELUGUCHAPTER - SURFACE AREAS AND VOLUMES EXERCISE - EXERCISE - 10.4
12 Videos
Similar Questions
Weights of parcels in a transport office are given below.

Find the mean weight of the parcels.
View SolutionGive 3 situations, where mean, median and mode are separately appropriate and counted.
Considier a situation where fans of two cricketers Raghu and Gautam claim that their sta score better than other. They made comparison on the basis of last 5 matches.

View SolutionSimplify the following expressions .
i) (5+√7)(2+√5)
ii) (5+√5)(5−√5)
iii) (√3+√7)2
iv) (√11−√7)(√11+√7)
View SolutionThe radius of sphere is 3.5cm Find its surface area and volume .
View SolutionHow many lines of symmetry does the above figure have ?
View SolutionWhich of the following are correct chain isomers of butane ? (i)
View SolutionDetermine the point of symmetry of a regular hexagon.
View SolutionDtermine the images of the following figure about the given line :
View SolutionMatch the following Column A to Column B

View SolutionMatch the following Column A to Column B

View SolutionMatch the following Column A to Column B

View SolutionFind the area of the figure given below.

View SolutionThe area of the shaded part in the figure given below is ______.

View SolutionThe inequation represented by the graph given below is :
View SolutionThe inequation that best describes the graph given below is _________
View SolutionThe inequation that best describes the following graph is _________
View Solution
