The screws produced by a certain machine were checked by examining samples of 7. The following table shows the distribution of 128 samples according to the number of defective items they contained.
 Fit a binomial distribution and find the expected frequencies if the chance of screw being defective is 12. Also find the mean and variance of the fitted distribution.Solution in Punjabi
Step by step video & image solution for The screws produced by a certain machine were checked by examining samples of 7. The following table shows the distribution of 128 samples according to the number of defective items they contained. Fit a binomial distribution and find the expected frequencies if the chance of screw being defective is 1/2. Also find the mean and variance of the fitted distribution. by Maths experts to help you in doubts & scoring excellent marks in Class 12 exams.
Updated on:21/07/2023Topper's Solved these Questions
Similar Questions
Compute P(A∣B),if P(B)=0.5 and P(A∩B)=0.32
View SolutionWrite the element a12 of the matrix A=[aij]2×2, whose elements are given by : aij=e2ixsinjx
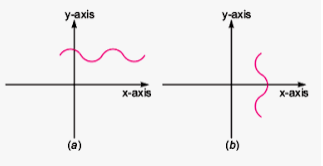
View SolutionWhich one of the following graph represents the function of x? Why?

View SolutionDetermine the point of symmetry of a regular hexagon.
View SolutionMatch the following Column A to Column B

View SolutionMatch the following Column A to Column B

View SolutionMatch the following Column A to Column B

View SolutionFind the area of figure given below.

View SolutionFind the perimeter of the figure given below.

View SolutionFind the area of the figure given below.

View SolutionThe inequation represented by the graph given below is :
View SolutionThe inequation that best describes the graph given below is _________
View SolutionThe inequation that best describes the following graph is _________
View SolutionIn Fig, find the value of x.
ltimg src="https://d10lpgp6xz60nq.cloudfront.net/physics_images/PS_MATH_IX_C12_S01_032_Q01.png" width="80%"gt
View SolutionFor shown situation find ∠BCA :-
ltimg src="https://d10lpgp6xz60nq.cloudfront.net/physics_images/ALN_PHY_R05_E01_035_Q01.png" width="80%"gt
View SolutionFind the magnitude of the resultant of shown forces :-
ltimg src="https://d10lpgp6xz60nq.cloudfront.net/physics_images/ALN_PHY_R02_E02_009_Q01.png" width="80%"gt
View Solution
