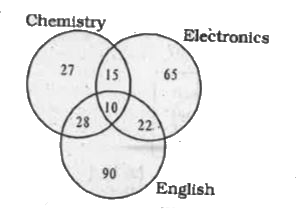
The diagram gives the number of candidates who failed in Chemistry, Electronics and English in different tests. The total number of candidates appeared was 600. What is the percentage of candidates who failed in at least two subject?
12.5
1.25
12.05
12
The correct Answer is:A
Total number of candidates who failed in at least two subjects = 15 + 10 + 28 +22 = 75 .
Percentage =75×100600=12.5
Topper's Solved these Questions
- BOOK - KIRAN PUBLICATIONCHAPTER - LOGICAL VENN - DIAGRAMEXERCISE - TYPE- II159videos
LOGICAL VENN - DIAGRAM
- BOOK - KIRAN PUBLICATIONCHAPTER - FINDING THE MISSING NUMBEREXERCISE - TYPE - II380videos
FINDING THE MISSING NUMBER
- BOOK - KIRAN PUBLICATIONCHAPTER - MIRROR & WATER IMAGES EXERCISE - TYPE -II9videos
MIRROR & WATER IMAGES
Similar Questions
Consider the Venn diagram given below:
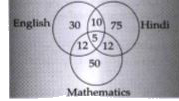
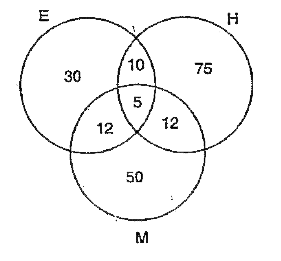
Five hundred candidates appeared in an examination comprising of tests in English, Hindi and Mathematics. The diagram gives the number of candidates who failed in different tests. What is the percentage of candidates who failed in at least two subjects ?View SolutionConsider the given diagram 500 candidate appeared in an examination conducted for the tests in English , Hindi and Maths represented by the circle E H and M respectively . the diagram gives the number of candidates who failed in different tests ?
What is the percentage of candidates who failed in atleast two subjects ?
 View Solution
Knowledge Check
- Question 1 - Select One
The following table represents the number of candidates that appeared and qualified in a competitive examination from different states over five years. Study the table and answer the questions that follow.
निम्नलिखित तालिका उन उम्मीदवारों की संख्या को दर्शाती है जो पाँच वर्षों के दौरान विभिन्न राज्यों से किसी प्रतियोगी परीक्षा में शामिल हुए तथा सफल हुए | इस तालिका का अध्ययन कीजिए तथा फिर पूछे गए प्रश्नों के उत्तर दीजिए | What was the total number of candidates appearing from all the states in the year 1997?
वर्ष 1997 में सभी राज्यों से शामिल होने वाले उम्मीदवारों की कुल संख्या कितनी है ?A27200B72200C22700D27000 - Question 2 - Select One
Study the following table and answer questions:
Number of candidates appeared in an examination from five cities:
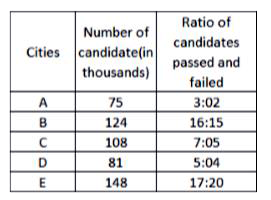
The number of candidates appearing for the examination from city D is what percent of the total number of candidates failed in cities A and B?A72B87C80D90 - Question 3 - Select One
The given pie chart shows the stream wise distribution (in degrees) of the candidates who applied for an entrance exam. The total number of candidates who applied was 720000 and out of which 5400 have qualified the exam
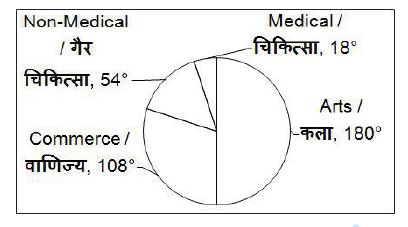
What percentage of the total candidates who applied for the exams have qualified it?A0.85B0.75C0.6D0.8
In an exam 49% candidates failed in English and 36% failed in Hindi and 15% failed in both subjects. If the total number of candidates who passed in English alone is 630. What is the total number of candidates appeared in exam?
View SolutionThe number of candidates appearing for the exam from city C is what percent of the number of candidates appearing for the exam from city B?
View SolutionIn an exam 49% candidates failed in English and 36% failed in Hindi and 15% failed in both subjects. If the total number of candidates who passed in English alone is 630. What is the total number of candidates appeared in exam?
View SolutionIn an examination, 60% of the candidates passed in English and 70% of the candidates passed in Mathematics, but 20% failed in both of these subjects. If 2500 candidates passed in both the subjects, the number of candi dates who appeared at the ex amination was
View SolutionThe given pie chart shows the stream wise distribution (in degrees) of the candidates who applied for an entrance exam. The total number of candidates who applied was 720000 and out of which 5400 have qualified the exam
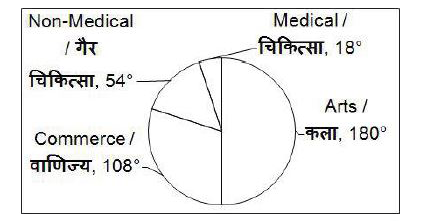
What percentage of the total candidates belong the non-medical?View Solution

