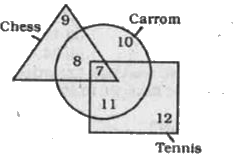
An interview of 60 persons to know whether they play Tennis, Chess or Carron was conducted . The data so obtained has bee summarized in a pictorial diagram as shown . Study the diagram and answer the question . How many persons do not play any games ?
28
7
4
3
The correct Answer is:D
The number of persons who play one game, two games and all the three games
= 9+ 8 + 10 + 12 + 11 + 7 = 57
Thus, 3 persons do not play any game.
Topper's Solved these Questions
- BOOK - KIRAN PUBLICATIONCHAPTER - LOGICAL VENN - DIAGRAMEXERCISE - TYPE- II159videos
LOGICAL VENN - DIAGRAM
- BOOK - KIRAN PUBLICATIONCHAPTER - FINDING THE MISSING NUMBEREXERCISE - TYPE - II380videos
FINDING THE MISSING NUMBER
- BOOK - KIRAN PUBLICATIONCHAPTER - MIRROR & WATER IMAGES EXERCISE - TYPE -II9videos
MIRROR & WATER IMAGES
Similar Questions
Study the given Venn diagram carefully and answer the following question.
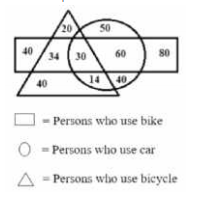 How many persons use both a bicycle and a bike but not a car?
View SolutionA survey was conducted in Aadarsh Vidyalaya to know the inclination of students towards different subjects. The data obtained is presented by the adjacent pie diagram. If the total number of students was 500, answer the following question.
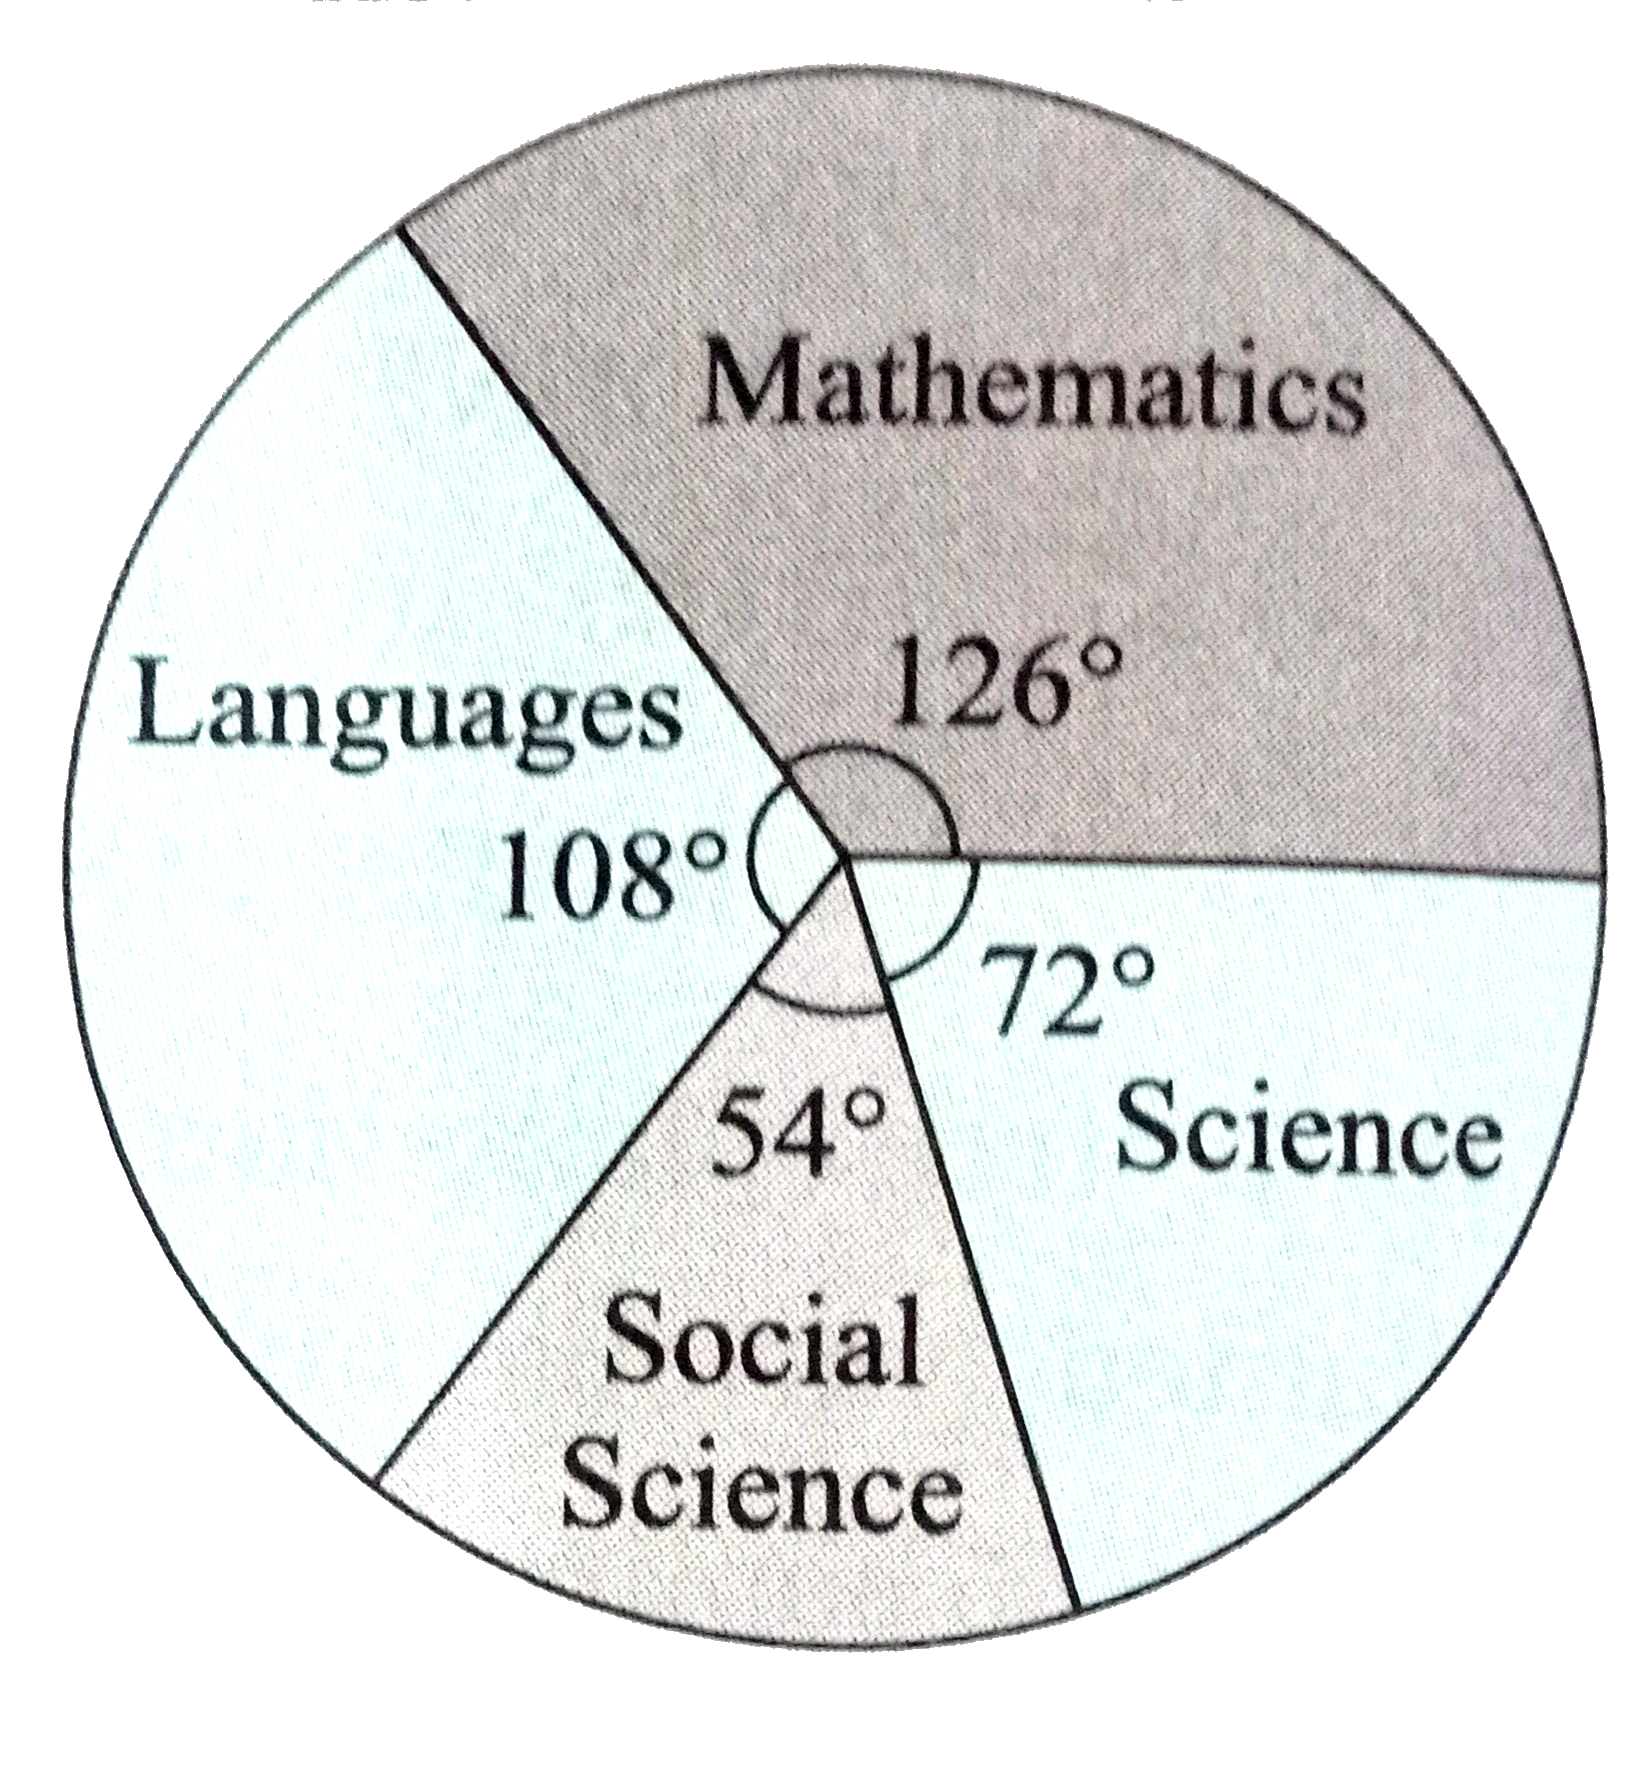
(i) How many students show inclination towards mathematics ?
(ii) How many students are inclined towards social science ?
(iii) How many more students are inclined towards languages than science ?View Solution
Knowledge Check
- Question 1 - Select One
The line graph shows the average hours per day spent by teenagers playing outdoor games. Study the diagram and answer the following questions.
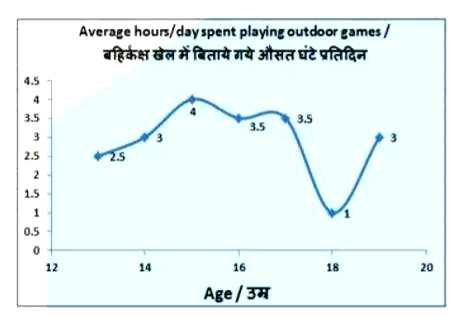
How many hours does a 16 year old spend playing outdoor games in a week?A24.5B25.5C24D25 - Question 2 - Select One
Study the given Venn diagram carefully and answer the following question .
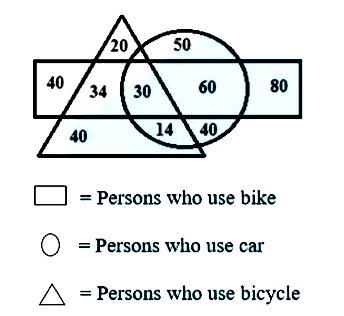
How many persons use both a bicycle and a bike but not a car ?A30B14C34D40 - Question 3 - Select One
The following bar graph shows the games played by the students. Study the graph carefully and answer the question given below:
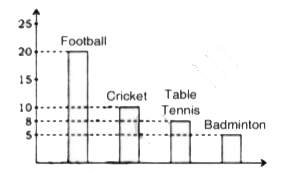
How many students play table tennis?A10B8C18D20
Out of 50 students of a class 25 play chess, 35 play Carroms. Use Venn diagrams to answer the following:(1) How many students play both the games ?(ii) How many students play only Chess ?
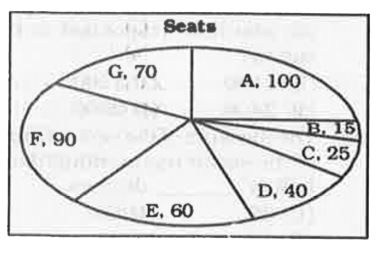
View SolutionThe pie chart graphs shows the number of seats that each party has in the lower house of the parliament. Study the diagram and answer the following questions.
If the data shows the seats of all the parties then the lower house of parliament has how many seats in total?View SolutionAnswer the questions on the basis of the information given below: Coach John sat with the score cards of Indian players from the 3 games in a one-day cricket tournament where the same set of players played for India and all the major batsman got out. John summarized the batting performance through three diagrams, one for each game. In each diagram, the three outer triangles communicate the number of runs scored by the three top scorers from India, where K, R, S,V and Y represent Kaif, Rahul, Saurav, Virender, and Yuvraj respectively. The middle triangle in each diagram denotes the percentage of total score that was scored by the top three Indian scorers in that game. No two players score the same number of runs in the same game. John also calculated two batting indices for each player based on his scores in the tournament, the R-index of a batsman is the difference between his highest and lowest scores in the 3 games while the M-index is the middle number, if his scores are arranged in a non-increasing order.

For how many Indian players is it possible to calculate the exact M-index?View SolutionAnswer the questions on the basis of the information given below: Coach John sat with the score cards of Indian players from the 3 games in a one-day cricket tournament where the same set of players played for India and all the major batsman got out. John summarized the batting performance through three diagrams, one for each game. In each diagram, the three outer triangles communicate the number of runs scored by the three top scorers from India, where K, R, S,V and Y represent Kaif, Rahul, Saurav, Virender, and Yuvraj respectively. The middle triangle in each diagram denotes the percentage of total score that was scored by the top three Indian scorers in that game. No two players score the same number of runs in the same game. John also calculated two batting indices for each player based on his scores in the tournament, the R-index of a batsman is the difference between his highest and lowest scores in the 3 games while the M-index is the middle number, if his scores are arranged in a non-increasing order.

How many players among those listed definitely scored less than Yuvraj in the tournament?View SolutionIn a class of 120 students, 46 play chess, 30 lay table tennis and 40 play carrom, 14 play chess and table tennis, 10 play table tennis and carrom , 8 play chess and carrom, and 30 students do not play any of these games. How many students play chess, table tennis and carrom ?
View Solution

