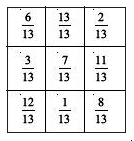
Check whether in this square the sum of the numbers in each row and in each column and along the diagonals is the same.
 Solution in Telugu
The correct Answer is:Sum in row =2113, Sum in column =2113 , Sum in diagonal =2113 All the sums are equal
Step by step video & image solution for Check whether in this square the sum of the numbers in each row and in each column and along the diagonals is the same. by Maths experts to help you in doubts & scoring excellent marks in Class 7 exams.
Updated on:21/07/2023Topper's Solved these Questions
- FRACTIONS, DECIMALS AND RATIONAL NUMBERSBOOK - NCERT TELUGUCHAPTER - FRACTIONS, DECIMALS AND RATIONAL NUMBERSEXERCISE - Exercise - 2
11 Videos
- FRACTIONS, DECIMALS AND RATIONAL NUMBERSBOOK - NCERT TELUGUCHAPTER - FRACTIONS, DECIMALS AND RATIONAL NUMBERSEXERCISE - Exercise - 3
13 Videos
- FRACTIONS, DECIMALS AND RATIONAL NUMBERSBOOK - NCERT TELUGUCHAPTER - FRACTIONS, DECIMALS AND RATIONAL NUMBERSEXERCISE - EXERCISE-7
13 Videos
- FRACTION ,DECIMALS AND RATIONAL NUMBERSBOOK - NCERT TELUGUCHAPTER - FRACTION ,DECIMALS AND RATIONAL NUMBERSEXERCISE - EXERCISE
438 Videos
- INTEGERS BOOK - NCERT TELUGUCHAPTER - INTEGERS EXERCISE - EXERCISE
411 Videos
Similar Questions
Multiply the following. Write the answer as a mixed fraction : 36×10
View SolutionFind each of the following products : 56×711
View SolutionWrite any three equivalent rational numbers to each of the following : 23
View SolutionRepresent 34, 14 in different ways using different figures. Justify your representation.
View SolutionSome integers are marked on the number line which is the biggest and which is the smallest?
View SolutionWhich of the following are correct chain isomers of butane ? (i)
View SolutionDetermine the point of symmetry of a regular hexagon.
View SolutionDtermine the images of the following figure about the given line :
View SolutionMatch the following Column A to Column B

View SolutionMatch the following Column A to Column B

View SolutionMatch the following Column A to Column B

View SolutionThe inequation represented by the graph given below is :
View SolutionThe inequation that best describes the graph given below is _________
View SolutionThe inequation that best describes the following graph is _________
View SolutionWhat is the distance OA for the square shown in figure :- ltimg src="https://d10lpgp6xz60nq.cloudfront.net/physics_images/ALN_PHY_R05_E01_015_Q01.png" width="80%"gt
View SolutionMatch the followings (column I with column II)
ltimg src="https://d10lpgp6xz60nq.cloudfront.net/physics_images/NCERT_BIO_XI_C03_E01_011_Q01.png" width="80%"gt
View Solution
