Direction: Study the data carefully and answer the following questions.
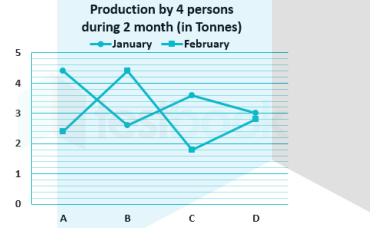
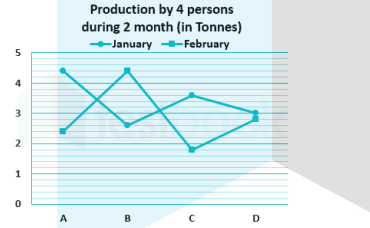
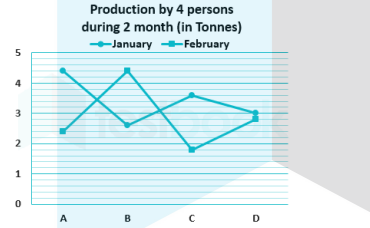
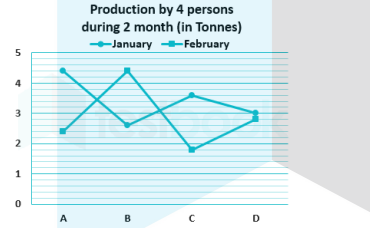
Following is the production data by 4 persons during 2 months.
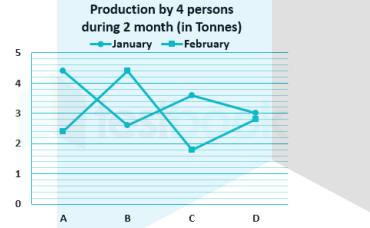
Find the ratio between production done by C and D together in January to production done by B
and C together in February.
Step by step video & image solution for Direction: Study the data carefully and answer the following questions. Following is the production data by 4 persons during 2 months.Find the ratio between production done by C and D together in January to production done by B and C together in February. by Maths experts to help you in doubts & scoring excellent marks in Class 14 exams.
Similar Questions
Direction: Study the data carefully and answer the following questions. Following is the production data by 4 persons during 2 months.
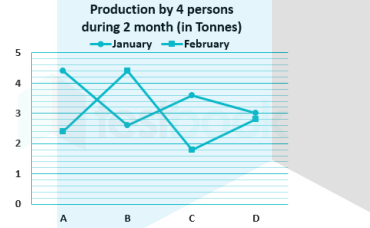
Find the average of total production done in February month.View SolutionDirection: Study the data carefully and answer the following questions. Following is the production data by 4 persons during 2 months.
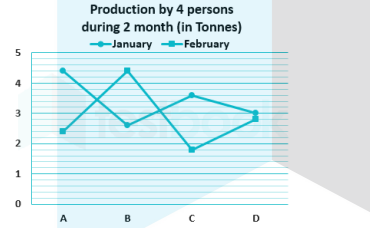
Find the total production by A in February month and by C in January month.View Solution
Knowledge Check
- Question 1 - Select One
Study the graph carefully and answer the following questions.
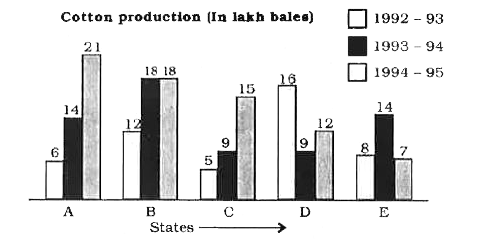
What is the average production of the four states in the year 1994-95 taken together ?A12.3B14.6C15.6D16.3
Direction: Study the data carefully and answer the following questions. Following is the production data by 4 persons during 2 months.
Find the difference between total production done in January to that of February (in Kg).View SolutionDirection: Study the data carefully and answer the following questions. Following is the production data by 4 persons during 2 months.
Production by A in January in what % more than production by B in January (Approx)?View SolutionDirection: Study the data carefully and answer the following questions. Following is the production data by 4 persons during 2 months.
A man rows down a river 30 km in 6 hrs with the stream and returns in 10 hrs. The rate at which he rows in still water isView SolutionDirection: Study the data carefully and answer the following questions. Following is the production data by 4 persons during 2 months.
By selling 9 pen for a rupee, a shopkeeper incurred a loss of 4%. To make a gain of 44%, the number of pen to be sold for a rupee isView SolutionStudy the data carefully and answer the following questions.
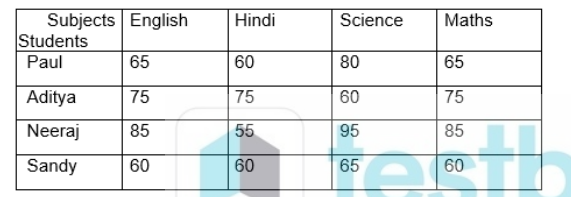
Find the average of the marks scored by Aditya in English, Hindi and Science together?View SolutionDirection: Study the data carefully and answer the following questions. Following is the data given of selling 2 types of pizza from 4 shops A, B, C and D.
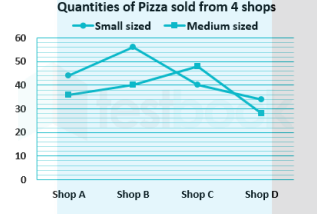
Find the ratio between total number of pizzas sold from shop C to that of shop B.View SolutionDirection: Study the data carefully and answer the following questions. Following is the data given of selling 2 types of pizza from 4 shops A, B, C and D.
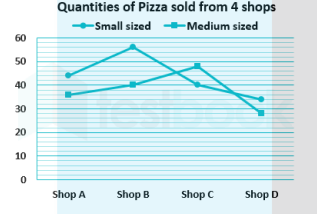
Find the difference between total number of small sized pizzas sold from shop A, B and D together and total number of pizza sold from Shop C together.View Solution

