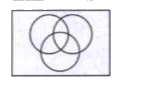
Select the diagram which best represents the relationship between educated people, unemployed and teachers.

A

B

C

D
Video Solution
Text Solution
The correct Answer is:A
|
Updated on:21/07/2023
Topper's Solved these Questions
- BOOK - LUCENT PUBLICATIONCHAPTER - LOGICAL VENN DIAGRAMS EXERCISE - EXERCISE -43videos
LOGICAL VENN DIAGRAMS
- BOOK - LUCENT PUBLICATIONCHAPTER - LOGICAL VENN DIAGRAMS EXERCISE - EXERCISE -231videos
LOGICAL VENN DIAGRAMS
- BOOK - LUCENT PUBLICATIONCHAPTER - LOGICAL DEDUCTION EXERCISE - EXERCISE-555videos
LOGICAL DEDUCTION
- BOOK - LUCENT PUBLICATIONCHAPTER - MATHEMATICAL ABILITY AND REASONINGEXERCISE - EXERCISE (Type-VI: Puzzle Based Problem)22videos
MATHEMATICAL ABILITY AND REASONING
Similar Questions
Knowledge Check
- Question 1 - Select One
Select the Venn diagram that best represents the relationship between the following classes. Males, Fathers, Accountants
A B
B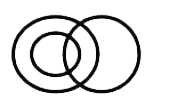 C
C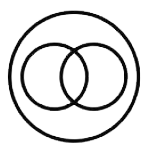 D
D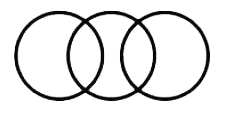
- Question 2 - Select One
Draw the venn diagram that best represents the relationship amongst the following classes:
Sisters, Mothers, MenA B
B C
C D
D
- Question 3 - Select One
Select the Venn Diagram that best represents the relationship between the following classes.
Infants, Males, FathersA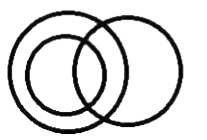 B
B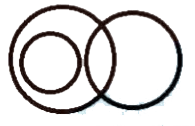 C
C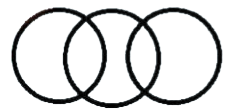 D
D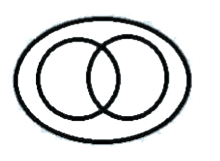
Select the Venn diagram that best represents the relationship between the following classes. Chandigarh, India, Seoul
View SolutionSelect the Venn diagram that best represents the relationship between the following classes. Animals, Cows, Dogs
View SolutionSelect the Venn diagram that best represents the relationship between the following classes.
Tortoise, Mammal, AmphibianView SolutionDraw the venn diagram that best represents the relationship amongst the following classes:
Star, Sun, MercuryView SolutionSelect the Venn diagram that best represents the relationship between the following classes. Fiber, Cotton, Jute
View Solution


