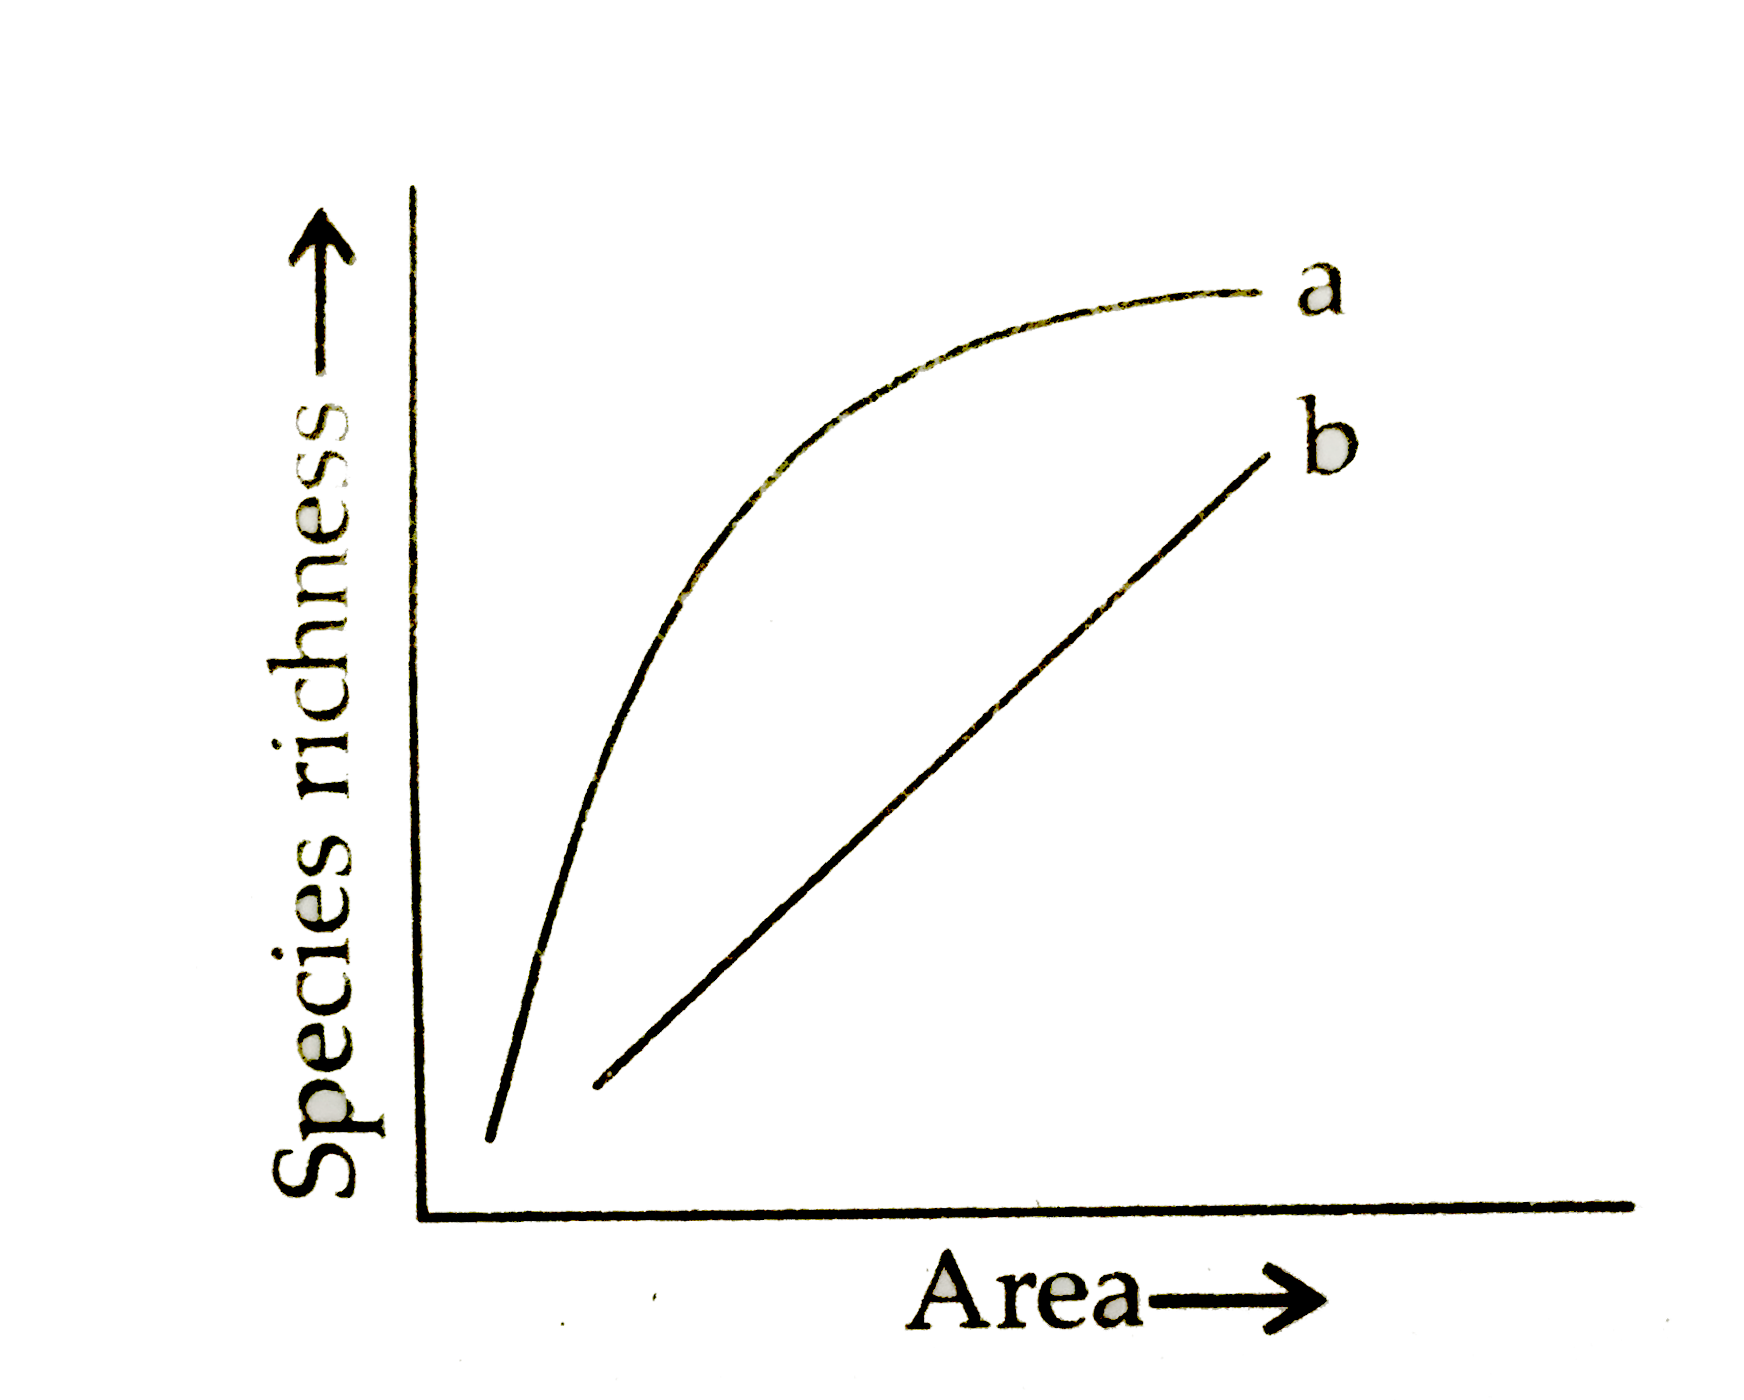
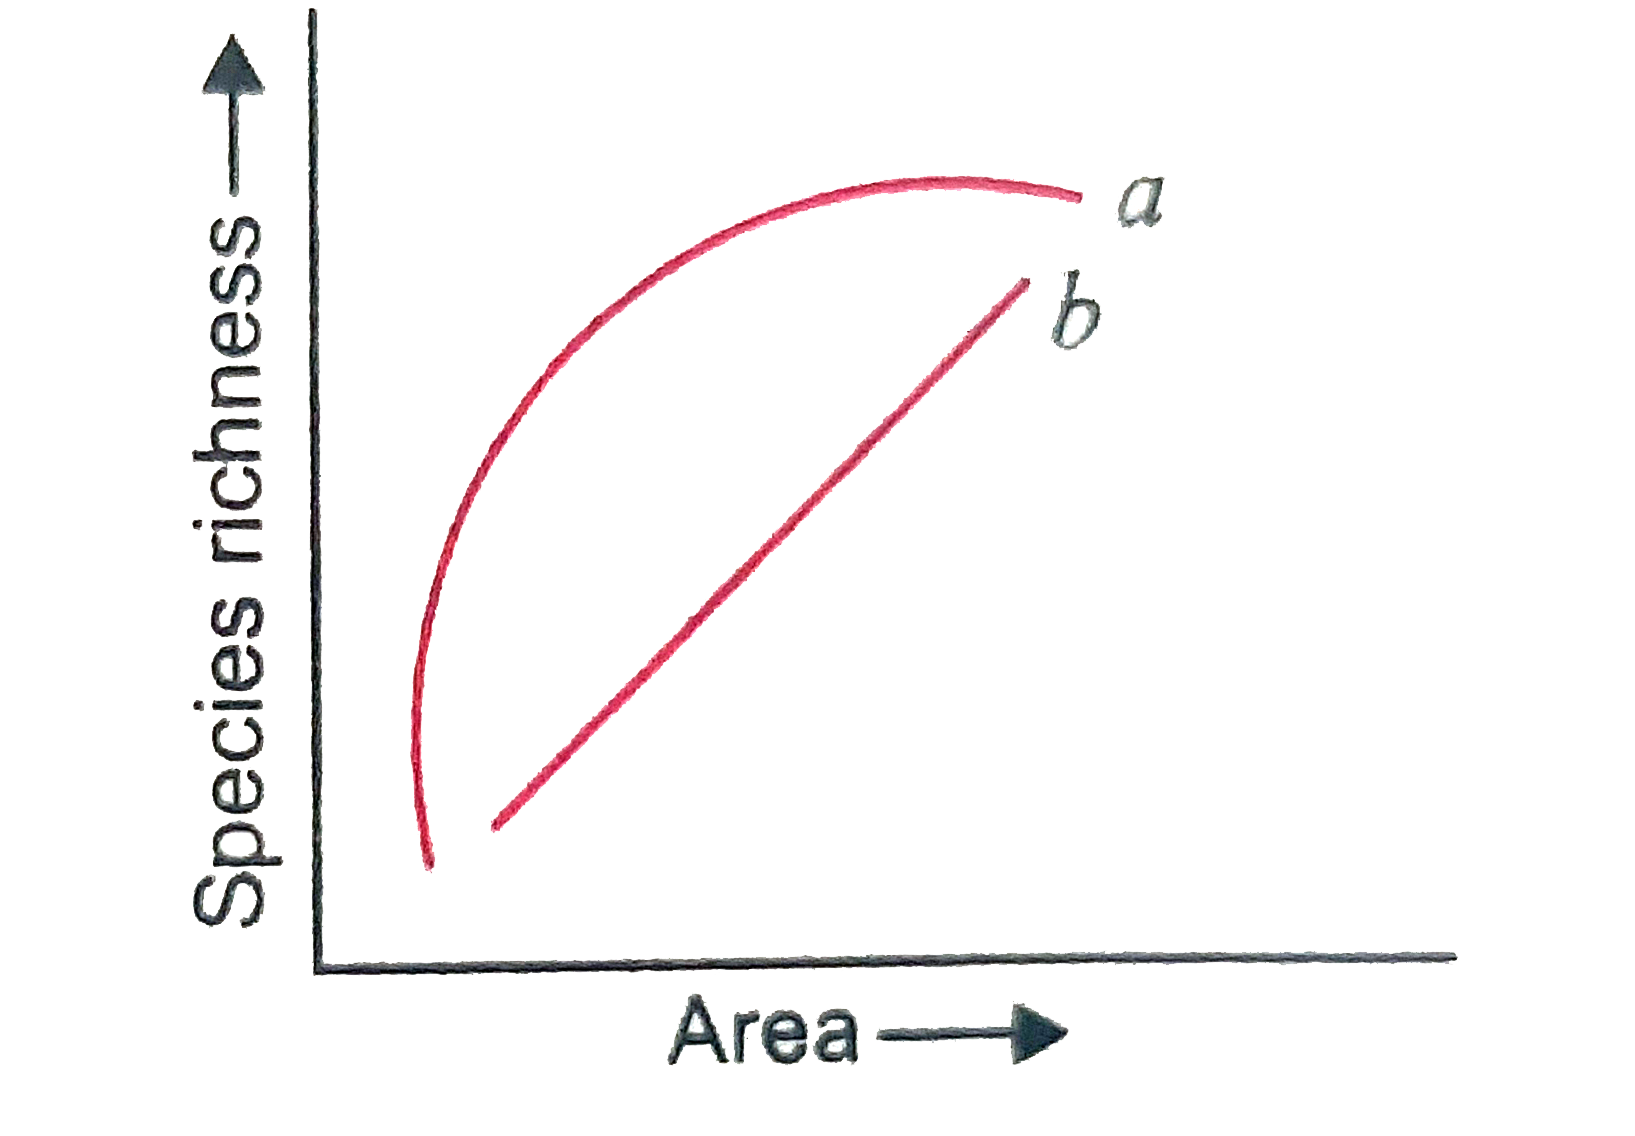
The above graph show Species-Area relationship. Write the equation of the curve a and explain.

Text Solution
On a log scale, the relationship becomes linear (Straight line) and is described equation
log S log C+Z log A
where
S = speices Richness
Z = slope of the line (regression cofficient )
A area
C= y- intercept
Ecologists have found out that the value of Z line ranges between 0.1 and 0.2 irrespective of the taxonomic group or the regio
this analysis in very large area like a continent, the Z value ranges between 0.6 and 1.2. The Z value for frugivorous birds and mammals in the tropical forest is found to be 1.15
|
Topper's Solved these Questions
- XII BOARDSBOOK - XII BOARDS PREVIOUS YEARCHAPTER - XII BOARDSEXERCISE - SET-II
44 Videos
- XII BOARDSBOOK - XII BOARDS PREVIOUS YEARCHAPTER - XII BOARDSEXERCISE - SET-III
57 Videos
- XII BOARDSBOOK - XII BOARDS PREVIOUS YEARCHAPTER - XII BOARDSEXERCISE - C.B.S.E CLASS XII
31 Videos
- SAMPLE PAPER 2019BOOK - XII BOARDS PREVIOUS YEARCHAPTER - SAMPLE PAPER 2019EXERCISE - Section E Part B
3 Videos
Similar Questions
Knowledge Check
Species-Area relationship was given by
ABritish zoologist and geographer David TilmanBGerman botanist and geographer Alexander von HumboldtCGerman naturalist and geographer Alexander von HumboldtDBritish naturalist and geographer Alexander von HuboldtSpecies area relationship was given by
AAlexander von HumboldtBPaulCMayerDBoth (a) and (b)Species area relationship was given by :-
ARobert constranzaBAlexander von humboldtCAlexander flemmingDStamford ecologist Paul Ehrlich
According to the concept of species-area relationship.
View SolutionThe hyperbolic equation for the species area relationship is
View SolutionAccording to the concept of species-area relationship.
View SolutionThe hyperbolic equation for the species area relationship is
View SolutionIn the equation of species-area relationship, the letter 'C' and 'Z' represent
View Solution

