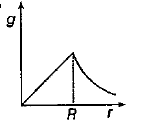
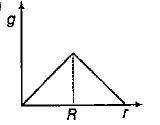
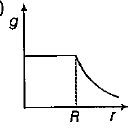
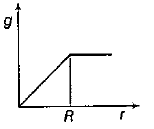
The graph showing acceleration due to gravity of the earth from the center of the earth is
A
B
C
D
Text Solution
The correct Answer is:A
|
Similar Questions
Knowledge Check
The value of acceleration due to gravity of the earth is
A98m/s2B9.8m/s2C0.98m/s2D0.098m/s2The value of acceleration due to gravity of earth :
Ais the same on equator and polesBis the least on polesCis the least on equatorDincrease from pole to equatorWhich of the following graphs shows the variation of acceleration due to gravity g with depth h from the surface of the earth ?
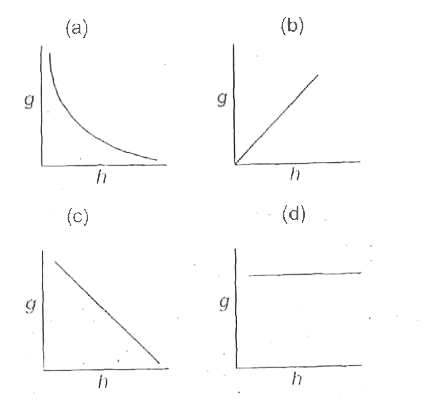 A(a)B(b)C(c )D(d)
Questions based on acceleration due to gravity of earth
View SolutionIf earth is assumed to be a sphere of uniform density then plot a graph between acceleration due to gravity (g) and distance from the centre of earth.
View SolutionIf R= radius of the earth and g= acceleration due to gravity on the surface of the earth, the acceleration due to gravity at a distance (r>R) from the centre of the earth is proportional to
View SolutionIf R= radius of the earth and g= acceleration due to gravity on the surface of the earth, the acceleration due to gravity at a distance (r<R) from the centre of the earth is proportional to
View SolutionAcceleration due to gravity at the centre of the earth is :-
View Solution
